Checkout
1. Introduction
This document is intended to be a "quick checkout" guide for WIYN support personnel as part of the "performance monitoring" program to be carried out during setup of the instruments. This might occur when WHIRC is installed to be used in conjunction with other instrumentation, such as OPTIC, but is not planned to be used for observing that night, so the normal WHIRC support person may not be present. Also, it is often desirable to carry out the "performance monitoring" when the instrument is installed but not being used simply to ensure that the instrument is operating properly or to provide warning of problems well in advance of a scheduled observing run.
A current set of exercises which checks out the basic operation of the detector, filter mechanisms, and control systems is:
- Bring up the instrument and observer interface
- Check the filter wheel positioning
- Take a series of dark frames at short integration time and verify the readnoise performance
- Take a flatfield image (or ambient Ks image) to verify the filter wheel operation and detector sensitivity
This list may be expanded or modified in the future. Also, if time is an issue, one may decide to make only the readnoise measurement, since it is likely that normal dark frame performance is indicative of normal detector response.
This checkout guide will be brief and cover only the specific tests described above. More extensive coverage can be found in the WHIRC User Guide or the WHIRC Characteristics Manual.
2. Bringing up WHIRC
A complete guide to bringing up the WHIRC system and setting up observations in the MOP can be found in the WHIRC User Guide. Here we provide only the short list in the spirit of a checklist for those who have carried out this procedure in the past. Note that the WIYN technical person carrying out these tests may have to perform the tasks of both the observer and the OA and should be checked out on the latter procedures before performing the steps of powering and biasing the detector.
The Observer steps are carried out at the observer terminal, assuming a login through the observer account. The OA steps are carried out in the engineering screens at the OA terminal.
- Observer: Single click clear PAN button to clear out any ongoing processes.
- OA: Single click the WHIRC Engineering window and check:
a. Temperature Control window
b. Filters window
c. Temperature Status window
- Observer: Single click start PAN button
- Wait for all 4 windows to open
- Be sure there are no errors
- If errors, click clear PAN button, then start PAN button again.
-
Observer: Single click start MOP button
a. MOP debug log window appears, make sure there are no errors
b. MOP Status window appears.
c. MOP control panel appears.
d. Wait until Filter status windows are green.
e. WTTM client window appears; may be iconified if WTTM not used. -
Observer: Single click start DS9 button
a. DS9 window opens -
Observer:Single click start PyRAF button
a. PyRAF window opens -
OA: Click WHIRC Bias button
a. Reconnect PAN
b. Update voltages
c. Power Detector
d. Bias Detector
e. Ensure both power and bias indicators are green -
Observer: Single click start WHOMP button (optional, WHOMP not needed for these tests)
a. WHOMP GUI opens
3. Filter Wheel Check
Each of the two filter wheels has eight legitimate positions, one of which is defined to be a fiducial or "home" location from which all of the other positions are referenced. A mechanical detent locates and maintains the desired filter in the beam. Moving from one filter to another involves the stepper motor putting out the calculated number of steps separating the initial and final locations and relying on the detent to pull the wheel into the exact position. Although there is no absolute encoding of the filter wheels, a small magnet in the wheel is designed to be adjacent to a gaussmeter sensor whenever the filter is in one of the detents, so it is possible to sense remotely if the wheel is in a detent. The magnet corresponding to the home position is reversed, so the gaussmeter reading in the home position will be of opposite polarity when the wheel is in the home position. If the filter wheel becomes lost due to a power fluctuation during a motion or when the system is first powered up, one should execute a "homing" procedure, which runs the filter wheel continuously at a slow speed while monitoring the gaussmeter until a peak signal of the home polarity is measured. The software then resets the position to "home" so that the relative step location of the other filters on the wheel is known.
Prior to starting up for the night, or to ensure that the wheel will really be in the OPAQUE position when carrying out the dark measurements described in the next section, it is worthwhile to home both filter wheels using the WHIRC Engineering GUI at the OA terminal.
- On the WHIRC Engineering GUI, select the Filter tab.
- For Filter Wheel 2, select the HOME button with the mouse.
- Monitor the progress on the GUI readouts. The procedure will require 2 - 3 minutes to complete:
a. The motor step count should increment
b. The gaussmeter field readout should change:
i) HOME = +800 to +1000 gauss
ii) in between positions = ~0 to 200 gauss
iii) any filter position other than HOME = -200 to -600 gauss
c. When completed, the DETENT will register HOME - Repeat this for Filter Wheel 1.
4. Dark/Readnoise Measurements
- On the MOP, set the filter to OPAQUE, if it is not already in that position.
- Ensure the the WHIRC Readout Mode is set to Fowler-1.
- If the system has just been powered up, take a few test frames first. Set up the MOP for the observation:
Exposure Type = Dark
Exposure = 5 s (4 s is OK as well)
Number of Frames = 1
File name = test - Engage the Observe button. Check the progress screens on the observer terminal to ensure that the countdown, Read-DHE, Read-net and DiskIO processes all work and that an image is written to disk and displayed on the ds9. Because it may take a few frames for the system to stabilize, take a few more.
- Set up for the dark measurements:
Number of Frames = 10
File name = dark_5 - Engage the Observe button. The system should take 10 frames, which will be of the name dark_5_001.fits ....dark_5_010.fits and will be written to the current data directory, which is the current date (e.g., /data/data/15_Sep_08).
- Move to the PyRAF window and change to the data directory and put the dark images into a list:
- files dark_5_*.fits > darklist
-
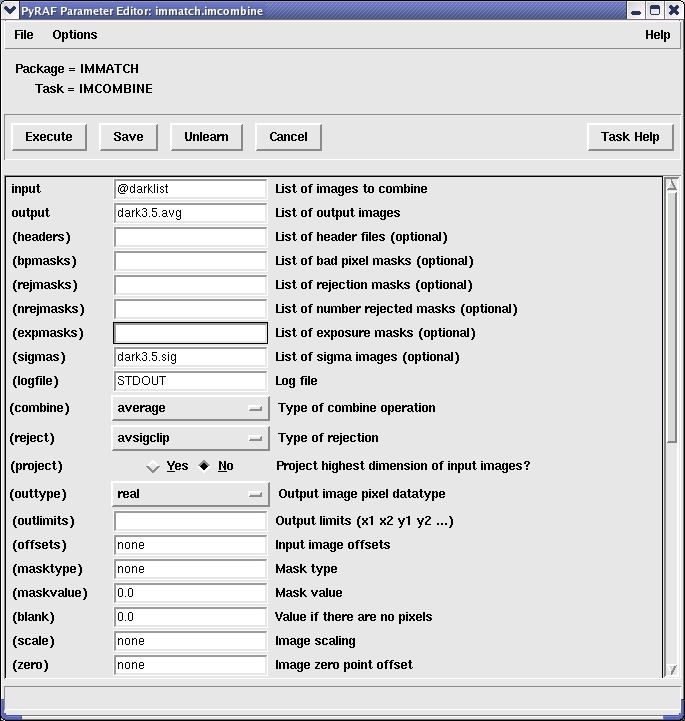
Set up the imcombine task by typing epar imcombine in the PyRAF window. This will bring up the table shown below in Figure 1; enter the parameters as in the Figure. This will combine the images in the file "darklist" using a pixel-by-pixel average, with averagesigmaclipping rejection (it will throw out individual points which deviate by more than 3 sigma, so that the results are not affected by the occasional random maverick pixel value). The results will be two images: in this case, dark3.5.avg (the average of the input frames) and dark3.5.sig (an image whose pixel values are the standard deviation of the mean of the input pixel values)
Figure 1: PyRAF screen for setting up the imcombine parameters.
-
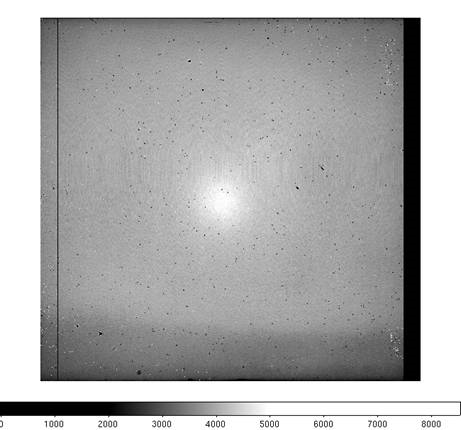
If you display the average and sigma images on the ds9 display, they should look similar to those shown below (also in the WHIRC Characteristics Manual).


re 2: (left panel): Average of ten 5s darks generated with the IRAF imcombine task with avsigmaclipping rejection. The "palmprint" on the left side of the detector and "cat scratches" in the upper right are regions of elevated dark current and hot pixels which are intrinsic to the array, as is the dead column 97 and row 286. (right panel): Sigma image of the 10 dark frames. The elevated read noise in the region of the "palmprint" is normal. The difference in noise between the amplifier channels can also be seen.
-
Check the statistics of the average and sigma images with imstat.
The important values are those for the sigma image, which are effectively the read noise. In this example, the typical values for the sigma image are around 8 ADU (I prefer the midpoint to the mean, since it rejects extreme pixels), or 32 electrons. If the images look similar to those shown in Figure 2 and the statistics for the sigma image are in the 8 - 9 ADU range, the system is performing nominally.
-
As a final verification, one can run the procedure imhist on the sigma image to obtain a histogram of the noise values.
Figure 3: PyRAF screen for setting up the imhist parameters for a dark sigma frame. Setting the "logy" to "yes" and "z2" to "50" displays the histogram on a logarithmic scale (see Figure 4).
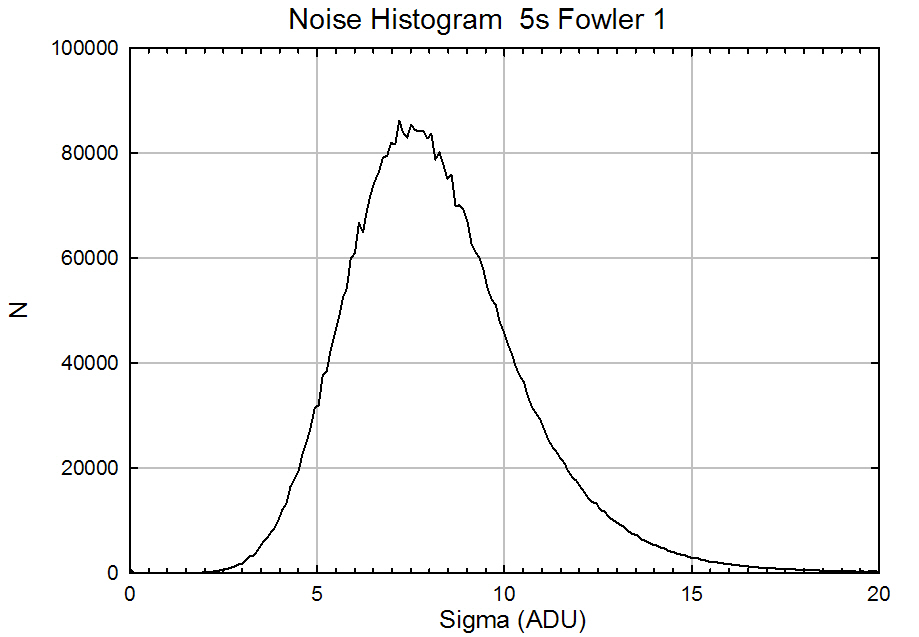
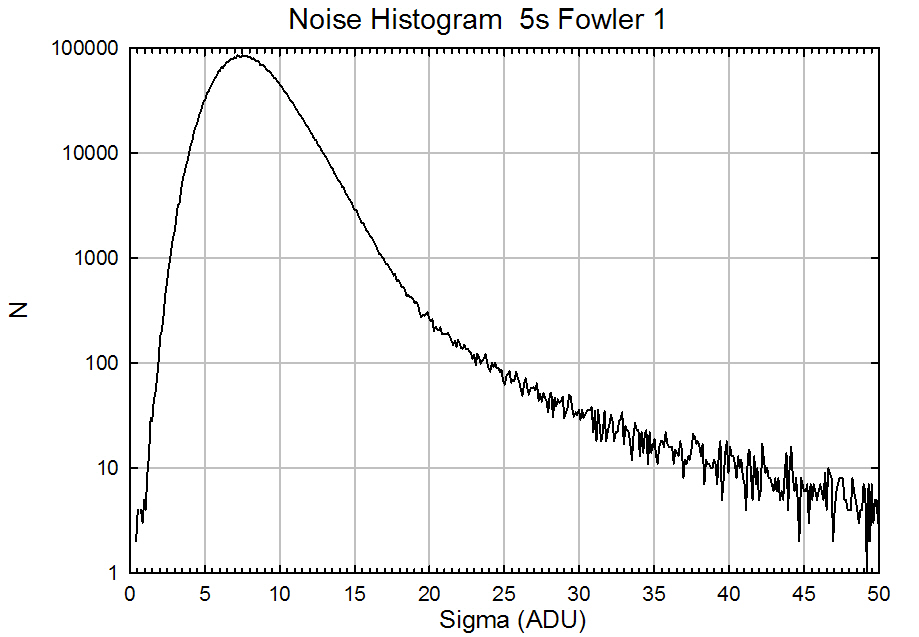
Figure 4: Histograms for a well-behaved sigma image from a series of 5 s Fowler-1 dark frames on a linear (left panel) and logarithmic (right panel) display. Note the peak value near 7.5 ADU and the smooth rolloff at higher sigma values in the logarithmic plot.
5. Responsivity Tests
If one wishes to check out the detector responsivity (as well as the filter wheel motion), one can observe the dome flat through one of the filters. Alternatively, if time is limited, one can obtain an image of the interior of the WTTM module through the Ks filter. Both are described below.
Flatfield Tests
- Move the telescope and dome to the proper locations for taking flats.
- Turn the flatfield lamp ON to a setting of 400.
- Open the telescope mirror covers.
- Move the WTTM slide IN to send the light to WHIRC.
- Set up the MOP as follows:
- Filter to H. Push the H button on the WHIRC Filters table and wait until the H and OPEN buttons turn green.
- Exposure type to Flat (optional)
- Exposure time = 5 s
- Number of frames = 1
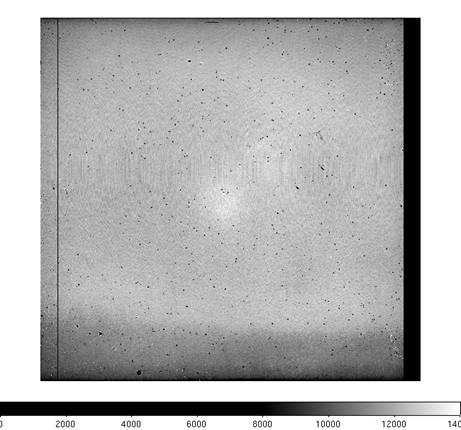
- Take a frame using Observe. You should see an image similar to that in Figure 5a, with a typical signal level ~ 12000 ADU.
- Turn the flatfield lamps OFF and take another image. You should see an image similar to that in Figure 5b, with typical signals ~ 70 ADU, depending on the ambient temperature.
 |
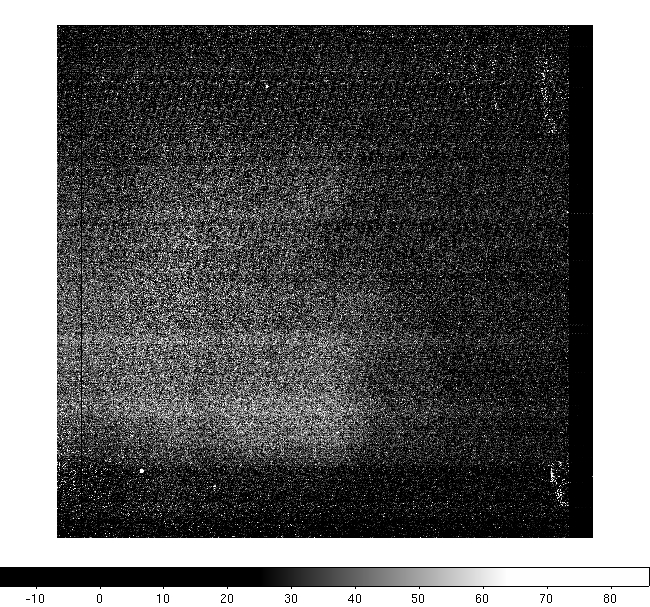 |
Figure 5: Flatfield images at H with the lamps ON at a level of 400 (left panel) and the lamp OFF (right panel). One should see an unvignetted image (the lower response at top and bottom is normal) at a level ~ 12000 ADU for a 5 s exposure time. The lamp OFF image is not completely dark, as there is some minimal thermal emission even in the H band, as well as possible scattered light.
Ambient Background
If one is lazy, the telescope is not available for pointing at the dome screen, or time is limited, one can verify filter wheel operation and reasonable signal levels by observing the ambient thermal background in the Ks filter. It is not necessary to move the WTTM slide into the beam, since the instrument will be viewing an ambient temperature blackbody in either case.
- Set up the MOP as follows:
- Filter to Ks. Push the Ks button on the WHIRC Filters table and wait until the Ks and OPEN buttons turn green.
- Exposure type to Flat (optional)
- Exposure time = 5 s
- Number of frames = 1
-
Take a frame using Observe. You should see an image similar to that in Figure 6, The background level will depend on the ambient temperature, but the unvignetted field and overall features of the image should verify that the imager is working properly.
Figure 6: Image of ambient background through the Ks filter. The signal level was ~ 4000 ADU for an ambient temperature ~ 23 C, and will vary considerably with temperature. However, the overall characteristics of the image should be invariant.
richard.joyce@noirlab.edu
Updated 15 December 2009
Updated on April 29, 2024, 10:58 am
