1.5m RC Observer Manual
R-C spectrograph is retired.
The 1.5-Meter Cassegrain Spectrograph
Michael Keane, Steve Heathcote & Robert Schommer
Provides a basic description of the 1.5-m R-C Spectrograph.
Introduction
Acquisition and guiding
RC Camera
RC Collimator
RC Comparison Sources
RC Control of spectrograph functions
RC Decker
RC Filters
RC Gratings
RC Shutter-Newall masks
RC Slit
RC Spectrograph rotation
RC System Efficiency
RC The Loral 1k CCD
Introduction
The 1.5-meter Cassegrain spectrograph is an ultraviolet transmitting grating spectrograph which is used at the f/7.5 focus where the scale is 18.1 arcseconds/mm. It is identical to the 2.1-meter telescope White Cassegrain spectrograph at Kitt Peak National Observatory and therefore allows one to obtain similar spectrograms in both hemispheres. The ARCON-IRAF software which is used to configure and readout the CCD detector is separately documented (see: The ARCON-IRAF Interface: Spectroscopy with the 4.0-m R-C Spectrograph. A Preliminary User's Guide). A version of an ARCON manual specifically for the 1.5-meter Cassegrain spectrograph is under development.
by michael keane
Acquisition and guiding
The spectrograph is mounted to the telescope by means of the 1.5-meter guider-acquisition module (GAM). This unit contains one TV camera on a motorized stage which can be used for field acquisition and offset guiding and a second fixed TV camera to view light reflected from the spectrograph slit jaws. The GAM probe accesses a 20cm square field (1º at f/7.5) although the field of view for the guide TV at any location covers approximately 2'x3'. A leaky guider module is connected to the first of these cameras to facilitate (?!) automatic guiding.
Camera
The 1.5-meter Cassegrain spectrograph uses a semi-solid Schmidt camera with 160mm focal length. The optics are entirely of quartz so that is has usable transmission to the atmospheric cutoff. However, this camera requires that the front window of the CCD dewar be a field flattening lens. Thus, not all CCDs may be used with this camera. Currently it is only used with a Loral 1200 x 800 CCD. This camera gives a demagnification of 4.78 and a "plate'' scale of $1.3" per 15micron pixel with the Loral 1K CCD. A slower f/ ratio camera upgrade is also in progress. This will provide a finer pixel sampling and a better match to the larger CCD.
Collimator
The focal length of the collimator is 766.1mm (30.16inches). The Pyrex mirror is figured as a 10o off-axis paraboloid, with a point-source beam diameter of 101.6mm (4.0inches).
Comparison sources
A neon discharge tube, an iron arc and an iron-argon hollow cathode discharge tube are available. A manual selector switch is at the junction of the sources on the spectrograph.
Control of spectrograph functions
The slit width and the comparison illumination system can be controlled remotely from the control room. All other controls are set manually at the spectrograph. We don't expect (or want) you to have to do this; your friendly observer support specialist and telescope operator will make adjustmets to the spectrograph for you. In fact, observer support will carry out all of the following tasks for you:
- Install gratings, optics, filters as specified on your Observer Support Questionnaire.
- Focus the spectrograph.
- Rotate the dewar so that the arc lines are aligned with the CCD columns at the center of the CCD.
- Set grating tilts to obtain approximately the wavelength coverage you have specified. But...You Have The Final Responsibility To Check That The Wavelength Coverage Is Correct.
- Help you to set the CCD parameters correctly. These include gain, binning, area on chip to be read out, which amplifiers to use.
- Help you to get flat field and arc lamp exposures in the afternoons.
- Fill the CCD dewar for you.
- Generally get you out of trouble. The observer support specialist is your primary contact at times when a telescope operator is not present. Call him if you need help.
Decker
The dimensions of the decker plate which defines the slit length are given in Table 1. With the decker in the open position, the slit illuminates $\sim 360$ rows on the Loral 1K CCD. There is some vignetting at the ends of the slit in the open position.
| Table 1: Decker Plate Dimensions for the 1.5-Meter Cassegrain Spectrograph | ||
| Stellar Window | ||
| Decker | At Slit | |
| Number | ||
| (mm) | (arcseconds) | |
| 1 | 0.90 | 16 |
| 2 | 1.55 | 28 |
| 3 | 2.20 | 40 |
| 4 | 3.00 | 54 |
| 5 | 3.75 | 68 |
| 6 | 4.50 | 81 |
| 7 | 6.00 | 109 |
| 8 | 8.90 | 161 |
| 9 | 11.90 | 215 |
| 10 | 17.75 | 321 |
| open | 25.40 | 460 |
Filters
There are two filter wheels each with a clear position and space for four 38.1mm (1.5 inch) diameter filters. The pre-slit filter wheel contains neutral density filters with nominal attenuations of 1.5, 5.0 and 7.5 magnitudes. Note that the light from the comparison lamps does not pass through these filters. Standard order-sorting filters are normally available in the post-slit wheel. These filters can be changed with some difficulty while the spectrograph is on the telescope. Focusing of the collimator must be performed with the appropriate post-slit, order-sorting filter in place.
Gratings
The 1.5-meter Cassegrain spectrograph has a fixed 55o angle between the optical axes of the collimator and camera. For sufficiently large grating tilts e.g., when observing at high dispersion, the beam coming from the collimator can overfill the grating resulting in the loss of a small amount of light. For the 1.5-m Cassegrain spectrograph, the collimated beam begins to overfill the grating for tilts greater than 20.o6 (grating tilt readout > 29.o 85 ).
The amount of light which might be lost due to overfilling the grating is almost always negligible, typically a few percent. In practice, this small loss would be more than offset by the ability to observe using a wider slit while preserving spectral resolution that results from the anamorphic demagnification at large grating tilts.
Table 2 lists the twelve 127mmx152mm Bausch & Lomb plane reflection gratings available with the spectrograph. Gratings tilts for the 1.5-m Cassegrain spectrograph are listed in Table 3.
Table 2: 1.5-Meter Cassegrain Spectrograph Gratings, 160mm Camera, Loral 1K (1200x800) CCD
| 1st Order | ||||
| No. | Lines/mm | Blaze1 (A) |
Resolution (A) |
Coverage (A) |
| 13 | 150 | 5000 | 17.2 | 6900 |
| 112 | 158 | 8000 | 16.4 | 6550 |
| 09 | 300 | 4000 | 8.6 | 3450 |
| 32 | 300 | 6750 | 8.6 | 3450 |
| 22 | 300 | 10000 | 8.6 | 3450 |
| 58 | 400 | 8000 | 6.5 | 2590 |
| 16 | 527 | 5500 | 4.8 | 1965 |
| 26 | 600 | 4000 | 4.3 | 1725 |
| 35 | 600 | 6750 | 4.3 | 1725 |
| 56 | 600 | 11000 | 4.3 | 1725 |
| 47 | 831 | 8000 | 3.1 | 1245 |
| 363 | 1200 | 7500 | 2.2 | 860 |
1 The value given for the blaze wavelength is the first order Littrow blaze. Effective blaze wavelength when used in the 1.5-m Cassegrain spectrograph is 0.89 of the Littrow value.
2 Gratings 11 & 22 are silver coated and thus does not reflect very much light below ~4000A.
3 Grating cannot be tilted far enough to be used in 2nd order.
Table 3: 1.5-Meter Cassegrain Spectrograph Gratings Tiles Center Wavelength
| Center Wavelengh | Grating Tilt Readout (°) | ||||||||
| Order | (A) | 36 | 47 | 58 | 26 | 09 | 35 | 32 | 56 |
| 0 | -- | 9.25 | 9.25 | 9.25 | 9.25 | 9°.25 | 9°.25 | 9°.25 | |
| 1 | 3800 | 15.07 | 12.16 | ||||||
| 4000 | 15.38 | 12.31 | |||||||
| 4200 | ° | 15.69 | 12.46 | ||||||
| 4400 | 16.00 | 12.61 | |||||||
| 4600 | 16.31 | 12.66 | |||||||
| 5800 | 27.34 | 18.46 | 13.67 | ||||||
| 6000 | 27.96 | 18.77 | 13.83 | ||||||
| 6200 | 28.58 | 19.08 | 13.98 | ||||||
| 6400 | 29.20 | 19.39 | 14.14 | ||||||
| 6600 | 29.82 | 19.70 | 14.29 | ||||||
| 6800 | 30.44 | 20.01 | 14.44 | ||||||
| 8400 | 21.83 | ||||||||
| 8800 | 22.45 | ||||||||
| 9200 | 23.10 | ||||||||
| 9600 | 23.73 | ||||||||
| 10000 | 24.36 | ||||||||
| 10400 | 25.00 | ||||||||
| 2 | 3800 | 25.58 | 16.99 | ||||||
| 4000 | 26.49 | 17.40 | |||||||
| 4200 | 27.40 | 17.82 | |||||||
| 4400 | 28.31 | 18.23 | |||||||
| 4600 | 29.22 | 18.64 | |||||||
Shutter-Newall masks
Accurate timing of exposures is obtained by means of a fast computer controlled shutter. A pair of Newall masks are available for quantitative focusing of the spectrograph. Successive exposures of a comparison source are taken through each mask. At perfect focus, the positions of the arc lines in these exposures coincide exactly. Increasing departures from focus lead to greater displacement of the arc lines between the images. The focusing procedure using the Newall masks is normally performed by observer support personnel.
Slit
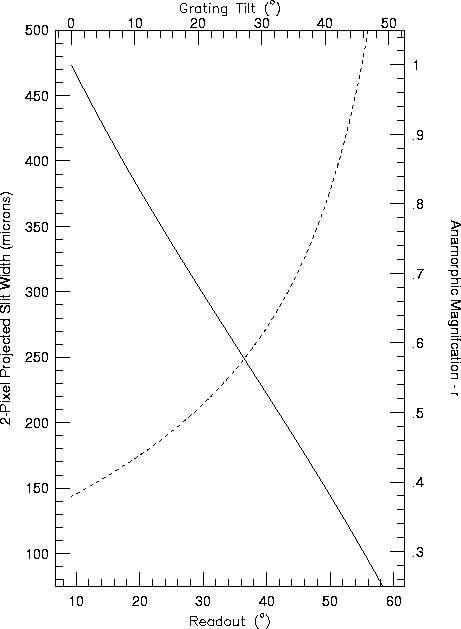
The slit has a maximum length of 25.4mm (460 arcseconds) and a width which can be set from closure to a maximum of 25.0mm. The width of the slit projected on the detector can be calculated from the information given in Figure 2. At the f/7.5focus, 1 arcsecond corresponds to about 55 micron.
Figure 2: Anamorphic demagnification of the 1.5-meter Cassegrain spectrograph (solid line) as a function of the grating tilt angle. Also shown (dashed line) is the slit width which projects to 2 pixels on the detector.
Spectrograph rotation
The spectrograph is normally operated with its slit E-W. In principle the spectrograph can be rotated to any position angle. However, this operation is performed manually and requires bringing the telescope to the zenith and raising the observing floor. Consequently frequent changes of the position angle should be avoided, and ten to fifteen minutes of overhead time should be allowed for each such operation. It should be further noted that the leaky guider only functions if the spectrograph slit is close to the E-W or N-S directions.
System Efficiency
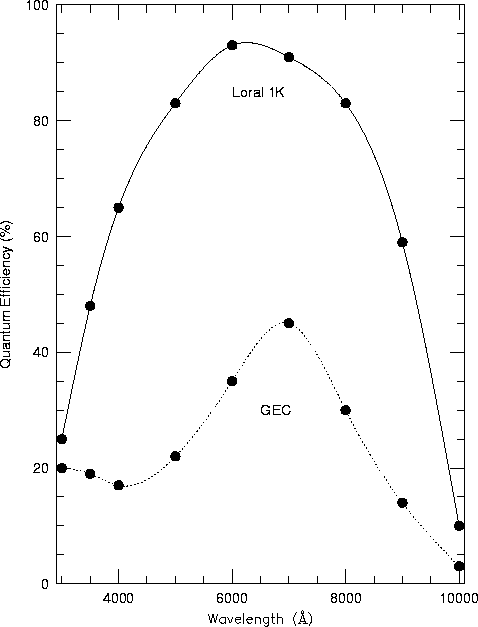
The quantum efficiency of the Loral 1K measured in the lab is given in Table 7 and shown in Figure 6. Also given is the quantum efficiency for the GEC CCD that the Loral 1K replaced; the Loral 1K offers a 2-3x gain in quantum efficiency over the GEC at most wavelengths.
Table 7: Quantum efficiency of the Loral 1K and GEC CCDs
| Wavelength (A) |
Quantum Efficiency (%) |
|
| Loral 1K | GEC | |
| 3000 | 25 | 20 |
| 3500 | 48 | 19 |
| 4000 | 65 | 17 |
| 5000 | 83 | 22 |
| 6000 | 93 | 35 |
| 7000 | 91 | 45 |
| 8000 | 83 | 30 |
| 9000 | 59 | 14 |
| 10000 | 10 | 3 |
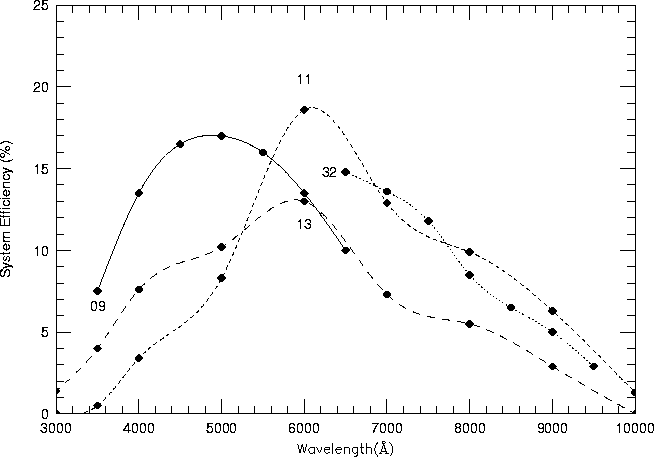
Efficiency measurements of the complete telescope/spectrograph/CCD combination using observations of spectrophotometric standard stars were obtained with gratings 09 and 32 on engineering nights in 1995 November. The results are given in the Table 8 and Figure 7 in terms of the percentage of photons striking the telescope primary mirror which are eventually detected. Also given in Table 8 and Figure 7 are the estimated efficiencies for gratings 11 and 13 that are obtained by scaling the measured system efficiencies with the GEC CCD by the ratio of the Loral and GEC quantum efficiencies.
Table 8: System Efficiency of the 1.5-Meter Cassegrain Spectrograph with Gratings 09, 32, 11 and 13
| Wavelength | System Efficiency | |||
| 09 | 32 | 11 | 13 | |
| 3000 | 0.0 | 1.4 | ||
| 3500 | 7.5 | 0.5 | 4.0 | |
| 4000 | 13.5 | 3.4 | 7.6 | |
| 4500 | 16.5 | |||
| 5000 | 17.0 | 8.3 | 10.2 | |
| 5500 | 16.0 | |||
| 6000 | 13.5 | 18.6 | 13.0 | |
| 6500 | 10.0 | 14.8 | ||
| 7000 | 13.6 | 12.9 | 7.3 | |
| 7500 | 11.8 | |||
| 8000 | 8.5 | 9.9 | 5.5 | |
| 8500 | 6.5 | |||
| 9000 | 5.0 | 6.3 | 2.9 | |
| 9500 | 2.9 | |||
| 10000 | 1.3 | 0.0 | ||
The Loral 1k CCD
With the old GEC CCD there was no evidence that the resolution of the spectrograph was limited by either the camera optics or the MTF of the detector. The measured FWHM of comparison lines corresponded very closely to the projected width of the spectrograph slit down to the Nyquist sampling limit, and 2 pixel FWHM resolution was routinely achieved. There was little variation of image quality with position on the chip, or with wavelength.
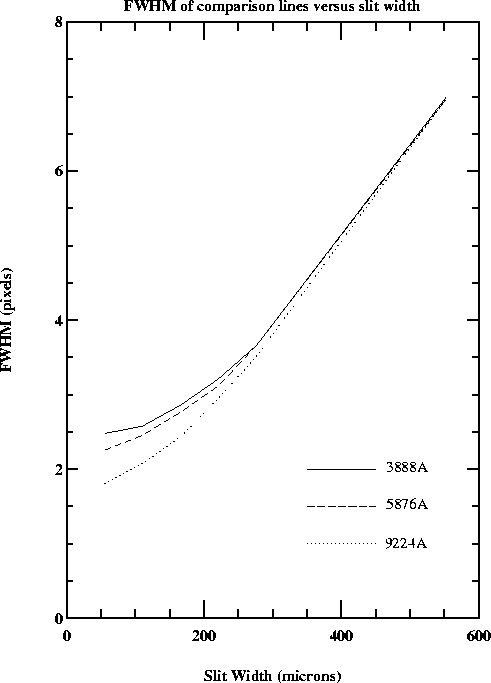
The Loral 1200x800 CCD now in use with the 1.5-m Cassegraon spectrograph has 15micron pixels and is 1.4 times longer than the GEC. Because of the finer sampling and larger size of this CCD it is expected that the camera optics will somewhat limit the resolution, especially at the extreme edges of the field. In addition at KPNO they have been unable to get images better than ~3 pixel FWHM with their Loral chips. This has been attributed to diffusion of photoelectrons within the CCD. This effect is greatest at blue wavelengths since higher energy photons are absorbed closer to the front surface of the CCD. Figure 3 shows the FWHM for spectral lines at the center (in X and Y) of the Loral 1K CCD as a function of the slit width; curves are shown for 3 wavelengths: 3888A, 6678A and 9224A.
The upper right amplifier of the Loral 1K does not perform satisfactorily, therefore this CD is read in single-channel mode (through the lower left amplifier). Full well ( $118,000e-) is reached before the ADC saturates at the higher gains settings (those having smaller values of e-/ADU). The non-linearity (peak-to-peak gain variation) is excellent (< 0.26%) for levels below full well or ADC saturation. The dark current is 4.25e-/pixel/hour.
Table: ARCON 3.9: Loral 1K (1200x800)
| Gain | Slope | 1/G | RON | Read Time | ||
| Index | (micro sec) | (e-/ADU) | (e-) | (sec) | ||
| LL | LR | LL | LR | |||
| 1 | 5 | 4.11 | 0 | 10.3 | 0 | 25.1 |
| 2 | 7 | 2.87 | 0 | 7.6 | 0 | 29.1 |
| 3 | 10 | 2.05 | 0 | 7.2 | 0 | 35.3 |
| 4 | 14 | 1.42 | 0 | 6.9 | 0 | 43.4 |
| 5 | 20 | 0.96 | 0 | 6.5 | 0 | 55.6 |
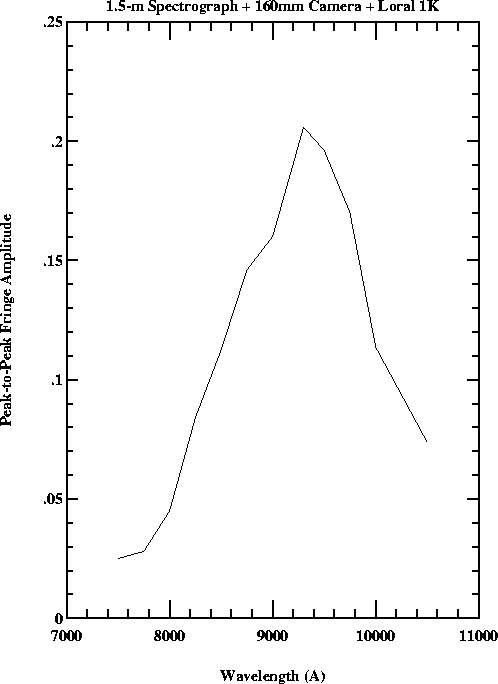
The Loral 1K CCD fringes with a substantial amplitude at wavelengths longer than 7500A (Figure 4). However, thanks to the lack of significant flexure in the 1.5-meter Cassegrain spectrograph and camera (Table 6), it is possible to remove nearly all of the fringing using normal dome flats. The fringes on the Loral 1K run approximately perpendicular to the dispersion. The peak-to-peak amplitude and fringe spacing are given in Table 5 and shown in Figure 11.
Table 5: Fringe Amplitude and Spacing with the Loral 1K CCD
| Wavelength (A) |
Amplitude (%) |
Spacing (A) |
| 7500 | 2.5 | 38 |
| 7750 | 2.8 | 40 |
| 8000 | 4.5 | 40 |
| 8250 | 8.4 | 46 |
| 8500 | 11.3 | 38 |
| 8750 | 14.6 | 42 |
| 9000 | 16.0 | 54 |
| 9300 | 20.6 | 54 |
| 9500 | 19.6 | 56 |
| 9750 | 17.0 | 66 |
| 10000 | 11.4 | 50 |
| 10500 | 7.4 | 60 |
Table 6: The displacements (in pixels) due to flexure parallel and perpendicular to the dispersion as a function of Hour Angle and Declination.
| Parallel to Dispersion | |||||||
| Declination | |||||||
| West | East | ||||||
| +30 | 0h.0 | ||||||
| +0.10 | |||||||
| 0 | 3h.0 | 0h.0 | 3h.0 | ||||
| +0.35 | -0.16 | -0.23 | |||||
| -30 | 4h.5 | 3h.0 | 1h.5 | 0h.0 | 1h.5 | 3h.0 | 4h.5 |
| +0.75 | +0.42 | +0.14 | 0.00 | -0.09 | -0.10 | -0.06 | |
| -60 | 5h.0 | 0h.0 | 5h.0 | ||||
| +0.79 | +0.13 | -0.06 | |||||
| -90 | 0h.0 | ||||||
| +0.68 | |||||||
| Perpendicular to Dispersion | |||||||
| Declination | |||||||
| West | East | ||||||
| +30 | 0h.0 | ||||||
| +0.10 | |||||||
| 0 | 3h.0 | 0h.0 | 3h.0 | ||||
| -0.66 | +0.08 | -0.23 | |||||
| -30 | 4h.5 | 3h.0 | 1h.5 | 0h.0 | 1h.5 | 3h.0 | 4h.5 |
| -0.75 | -0.61 | -0.29 | 0.00 | +0.26 | +0.34 | +0.37 | |
| -60 | 5h.0 | 0h.0 | 5h.0 | ||||
| +0.81 | -0.10 | +0.40 | |||||
| -90 | 0h.0 | ||||||
| -0.49 | |||||||
Updated on April 18, 2024, 9:39 am
