WIYN 0.9 Meter Filter Information
S2KB CCD and Filter Info
Pixel Size: 21x21 microns
Pixel Scale: 0.60 arcsec/pixel
Chip Size: 2048 x 2048
Digital Limitation: 65,534
Bias Level: ~650 (gain=#4)
Preflash, e-: none
Dwell Time, microsec: 2 3 5 8 15
Noise, e-/RMS: ? ? 20 14-15 9-10
Gain, e-/ADU: 9.8 6.5 3.9 2.5 1.3
Gain, Index#: 1 2 3 4 5
Linearity,0.1%,e-: ~210,000
Linearity,1.0%,e-: ~230,000
Column Spillover, e-: ~240,000
Internal Radiation Event Rate, Events/HR: ~2700
Dewar Temp. deg C: ~-107
CCD Temp. deg C: ~-99
Dark Current, e-/hr/pix: ~5-10
Hot Columns: [1571:1571,1134:2048] bias
: [2066:2066,1:2048] in overscan region, see comment below
Low Columns: [1103:1103,744:2048] flat field
The quantum efficiency of S2KB is given in this figure. The abscissa is wavelength in nanometers and the ordinate is dQE (%).
Here are some of the original calibration frames for S2KB.
There is a hot column in the overscan region, [2066:2066,1:2048]. Check for the presence and position of this column in your data. You will probably NOT want to use the default BIASSEC in CCDPROC, but rather set BIASSEC to [2053:2064,1:2048] or a similar region of your choosing.
More recently, S2KB has developed an enhanced bias level in one corner amounting to a peak of ~1500 ADU above an overall level of ~965 ADU. This bias exposure shows this effect. The enhancement is limited to the region X < ~240 pix and Y> ~1800 pix.
You can estimate exposure times for S2KB using the CCDTIME package in IRAF v2.11.3 which should still have the necessary information in its ccdtime$kpno.dat database file. If it does not, here is the kpno.dat file.
S2kb Scattered Light and Over-Illumination
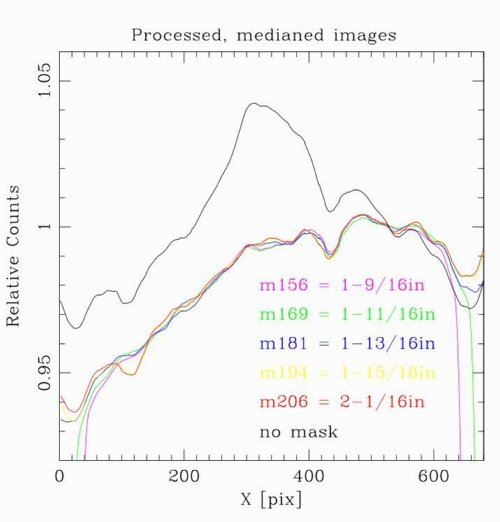
When taking dome and sky flats with S2KB, it has been noticed that there is a bright region near the center of the chip (it is more prominent in redder filters). Usually, such brightness variations affect both the flats and object images, and are removed from the latter when divided by the former during image processing. However, two independent teams realized that this may not be the case. Both teams found residuals in their all-sky photometric calibrations that roughly correlate with radial position on the chip and hence the position of the bright region. A preliminary test was done by inserting a mask in front of the dewar window to block light from entering the dewar that is not bound for the CCD itself. Apparently this light would bounce off reflective surfaces inside the dewar, reflect off the inside of the dewar window, and back onto the CCD to form the central bright region. Dome flats taken with the mask in place showed no significant central overillumination. For example:
A (median-combined) image with no mask
Ananalogous image with a mask
A plot showing cuts across these images (heavily smoothed) at the Y of the central bump (black curve is no mask, colored curves are the different sized masks. Yellow shows the best compromise between size and vignetting of the chip edges)
As seen, the central bump is about 4% higher than the surroundings. For surface brightness work this may be negligible, but for stellar photometry it creates problems. To remove the effect from all new data that is taken, NOAO made a permanent mask that as of 2008B is now affixed to the front of the dewar window. Andy Layden is working on a set of recommendations for how to mitigate (hopefully remove) the effect of the overillumination in previously-taken data. His work will focus on stellar photometry problems and be available to the consortium as soon as it is complete.
If anyone would like to be in on this process, your thoughts are welcome. Advice on tackling this from a surface brightness perspective is greatly encouraged. Please contact Andy Layden, layden@baade.bgsu.edu if you have any input.
Filters
Each filter is 4x4 inches square.
The passbands of the most commonly used filters are collected (and shown graphically) in a single spreadsheet for convenience:
S2KB
Updated on June 16, 2021, 11:26 am


