The Goodman Software
The Goodman Spectrograph Control System (GSCS) is a system of Labview programs running on a Windows machine, with which observers control the spectrograph and take data using its CCD camera. To access this software, users must use a graphical desktop sharing system to connect to the spectrograph’s control computer. We recommend using a VNC connection (see the SOAR Remote Observer's Guide), but other types of software may be used, such as Windows Remote Desktop. The following set of instructions for linking to the Goodman computer assumes that the user has established a secure VPN connection and will use a VNC or Remote Desktop session (click here to for a PDF document providing additional information on how to connect and run the Goodman GUI). This document shows the example for the Blue Camera. For the Red Camera only the name of the computer changes (see below). Note that you will not be able to connect if you have not first established the VPN connection.
Logging on to the Data Acquisition and Data Analysis Computers
The data acquisition computers are:
- soaric2 if using the Goodman Blue Camera
- soaric6 if using the Goodman Red Camera.
Usually it is best to connect using computer IPs directly (this way you avoid DNS name resolution issues). Ask your support scientist for the IP addresses you will need for observing with Goodman:
- Goodman BLUE computer or Goodman RED computer (depending whether you are using the BLUE or RED cameras respectively)
- Goodman IRAF data visualization and analysis computer (soaric7. You will need also the appropriate XServer number depending on your institution: NOIRLab, Brazil, UNC, MSU or Chile).
- Goodman Acquisition Camera (GACAM) computer
There are several ways to logon to the IRAF data visualization and analysis computer soaric7, depending upon your preference. These methods are discussed below.
- From Cerro Pachón:
- The mountain staff or your support scientist will show you the computer on which you can obtain and analyze your data. To open the Goodman user control panels:
- Double click on the "Scroll Lock" Key
- A window will open displaying the names of the computers to which you can connect
- Use the "Up" and "Down" arrow keys to highlight a free machine.
- If the Data Acquisition and Analysis windows are running, you can skip to the GUI Layout section of this manual. If these GUIs are not running, skip to the Starting and Stopping the Data Acquisition GUI and Starting and Stopping the Data Analysis GUI sections of this Manual.
- The mountain staff or your support scientist will show you the computer on which you can obtain and analyze your data. To open the Goodman user control panels:
- From the Remote Observing Center in La Serena:
- Log on to the observing account using the username and password provided to you by the instrument scientist (Sean Points, César Briceño, Regis Cartier or Alfredo Zenteno if your time is through NOIRLab or Chile, or your Brazilian Support astronomer if you are observing through Brazil time). If forgotten, these are posted on a list near the door.
- Start the Data Acquisition GUI by typing the following command from a terminal command line on the GNU/Linux computer in the remote observing center:
- > vncviewer -Shared "BLUE camera computer IP" & (Blue Camera)
- > vncviewer -Shared "RED camera computer IP" & (Red Camera)
Log on to the vncviewer with the password provided by the instrument scientist. - Start the Data Analysis GUI by typing the following command from a terminal command line on the GNU/Linux computer in the remote observing center:
- > vncviewer -Shared "soaric7 IP":4 &
Log on to the vncviewer with the password provided by the instrument scientist.
- If you are a Remote Observer:
- Start the VPN connection on your computer, using the username and password information provided by your Support Scientist: Sean Points or César Briceño if your time is through NOIRLab or Chile, your Brazilian Support astronomer if you are observing through Brazil time, or your SOAR Support person at UNC or MSU.
- Start the Data Acquisition GUI by typing the following command from a terminal command line on the GNU/Linux computer in the remote observing center:
- > vncviewer -Shared "BLUE camera computer IP" & (Blue Camera)
- > vncviewer -Shared "RED camera computer IP" & (Red Camera)
- Log on to the vncviewer with the password provided by the instrument scientist. Set this GUI in one of your monitors.
- Start the Data Analysis GUI by typing the following command from a terminal command line on the GNU/Linux computer in the remote observing center:
- > vncviewer -Shared "soaric7 IP":4 &
Log on to the vncviewer with the password provided by the instrument scientist. Set this GUI in another of your monitors. Remember that a minimum of 2 monitors is required to carry out remote observing at SOAR, and the recommended setup is 3 monitors (see the SOAR Remote Observer's Guide).
In most cases the GUIs should be started and you will be presented with a data acquisition screen and data analysis screen as shown in Figure 4.
Figure 4: The Goodman Data Acquisition and Data Analysis GUI windows.
Starting and Stopping the Data Acquisition GUI
If the data acquisition GUI has not been started, then one should see a blue screen in the Goodman BLUE computer VNC window. At the bottom of the screen, you should see that the SI Image SGL D and SI Image are minimized. You may also see that the LabVIEW Transfer_To_SOARIC7 vi and the LabVIEW Goodman Spectrograph Control System vi are minimized. If these are minimized, the you just need to click on them to start the data acquisition GUI. Click here for a PDF file with additional information on the start-up of Goodman.
To start the data acquisition software:
Figure 5: Selecting the CCD parameters (e.g., 1x1 imaging, 2x2 imaging, 1x1 spectroscopic, 2x2 spectroscopic, etc.)
- Click the Transfer_To_SOARIC7 LabVIEW shortcut on the Desktop and start the application by clicking on the white arrow.
- Open the Goodman controls by clicking on the GSP_Main LabView shortcut on the Desktop and start the application by clicking on the white arrow.
- Check the camera panel. If a green button is present for "Connection Open/Getting Data" in the upper left of the GUI, Goodman "sees" the SI Image camera control software and a TCP/IP connection is available to take data. You can confirm this by clicking on the "Obtain Camera Status" button. During a normal startup of the GSP_Main vi the CCD Temp will read "0". If the TCP/IP connection is operating, clicking on the "Obtain Camera Status" button will show the latest temperature measurement. If Goodman is cooled, the CCD Temp should be -106.5. If the CCD Temp does not update, you will need to check the SI Image SGL D window and make sure that a TCP/IP connection is open.
- Click on Main tab and logon;
Use the account appropriate for your observing program (i.e., BRAZIL, CHILE, MSU, NOAO, OTHER, or UNC) with the password provided by your institution. - Click the User tab, go to "Home Systems", and select "Home All". You should see the dark green lights change to yellow on the control panel as systems are being homed. Upon a successful homing of the systems, all lights should be bright green, except the Collimator Focus which well remain a dark green. If there are any red lights, you will need to log out of GSP_Main and shutdown and cycle the power on the Goodman motor electronics.
- After the camera is homed, start the flexure correction by clicking the flexure LED. It should change from dark green to bright green.
- Select the imaging or spectroscopic mode in which you want to work.
- Select Gain and Readout Setting. These values are given in the Goodman Overview and in the Goodman Cheat Sheet. Usual values are 100 KHz ATTN0 with the Blue Camera, which provides gain=1.06 and readout noise= 3.72 e-, and 344KHz ATTN3 with the Red Camera, which provides gain=1.48 and read noise=3.89.
- Set up the grating and camera angles for your observations. The pre-defined modes are listed in the Goodman Overview.
- You are now ready to use Goodman.
If the data acquisition GUI needs to be stopped:
- Single click on the Main tab and log out.
- Click on the Main tab and Shutdown. This will move all the systems back to their "Home" positions.
- After the shutdown has finished you should ask the TelOps staff to turn off the power to the Goodman electronics box.
A more detailed explanation of the Startup and Shutdown procedures can be found in the Goodman step-by-step User's Observing Guide (PDF).
Starting and Stopping the Data Analysis GUI
The Goodman data analysis VNC window (soaric7:4) has a relatively simple layout. If the IRAF data analysis windows are not open, you should see an IRAF button in the lower right corner of the VNC window. Single click on the IRAF button and an IRAF xgterm and a ds9 window will open. Load any IRAF package you may need for your observing. You will also want to make sure that you are in the correct directory to analyze your data.
> cd /home3/observer/today/
Basic GUI Layout
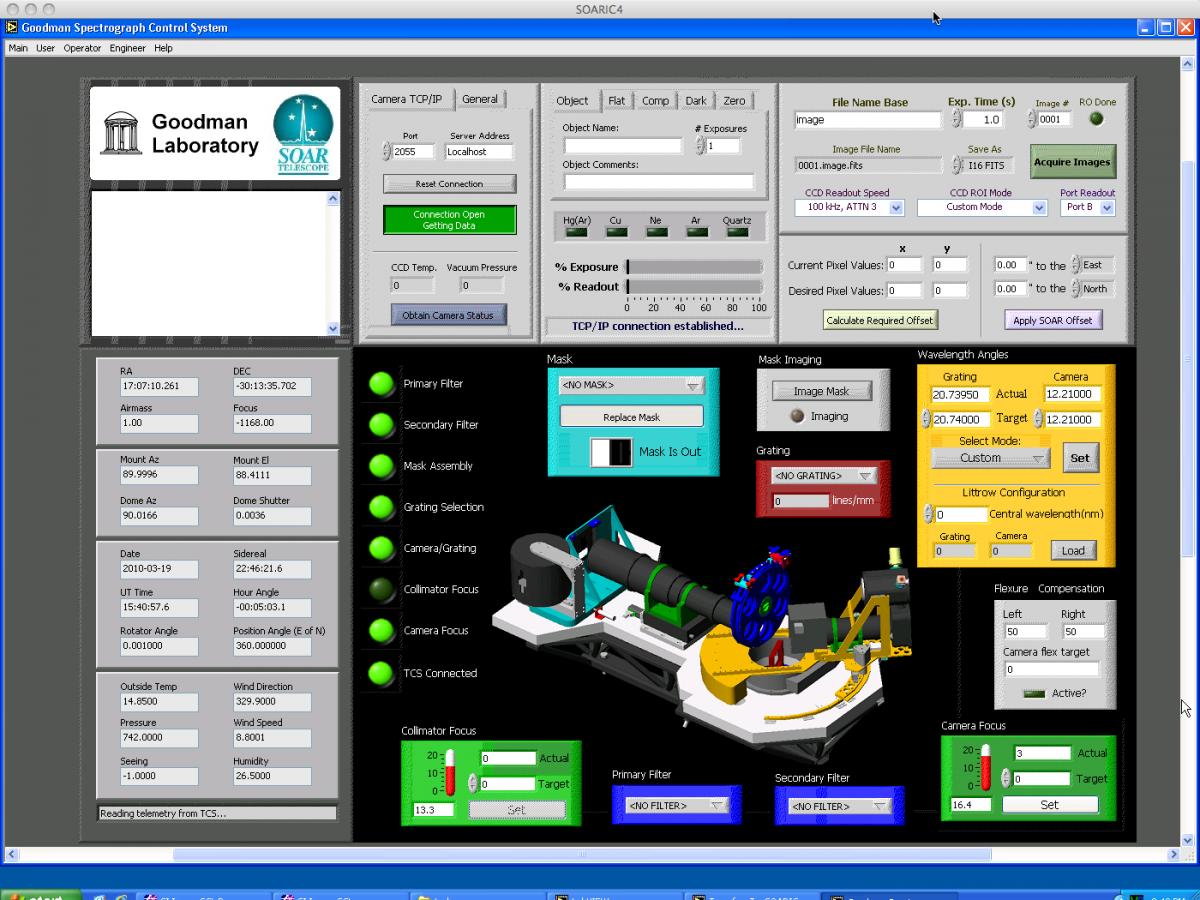
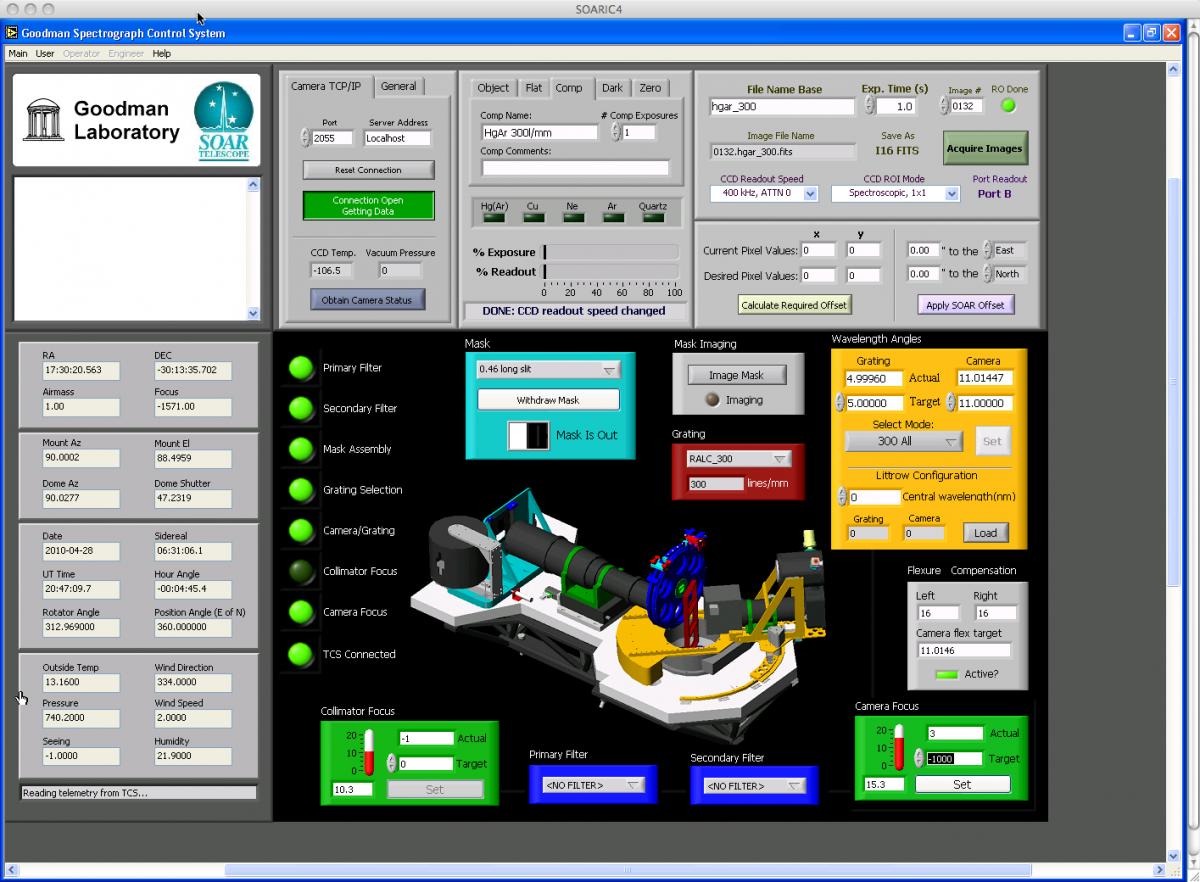
All observing with the Goodman Spectrograph is handled through the Data Acquisition GUI. Upon successful startup of the Goodman data acquisition GUI on soaric2, one should check that the Goodman data acquisition window looks something like that shown in Figure 4.
The Goodman observing GUI can be divided into certain distinct regions as shown in Figure 7. These include the:
- TCS Status Region - This region shows various telemetry data from the instrument, as well as information obtained from the Telescope Control System (TCS) and the SOAR Environmental Station. These data include the current RA and Dec of the telescope, the airmass, the sidereal time, the ISB rotator angle, etc.
- Connection Info Region - This region shows if the LabVIEW GSP_Main vi has a TCP/IP connection to the SI Image software. If the conection is active, then you should see a green box stating that the TCP/IP conection is open and that the SI Image software is receiving commands from the GSP_Main vi. One method of checking this connection is to click on the "Obtain Camera Status" button while you are not taking an image. This should update the "CCD Temp." and "Vacuum Pressure" fields above the camera status button. Also included in this section of the GUI is the "General" tab. If an observer selects this, they will be able to edit the "Observer" and "Proposal ID" keywords for the FITS headers.
- Acquisition and Exposure Status Region - This region of the GUI is complex and contains many items of which the observer should note. In this region, the observer can do the following:
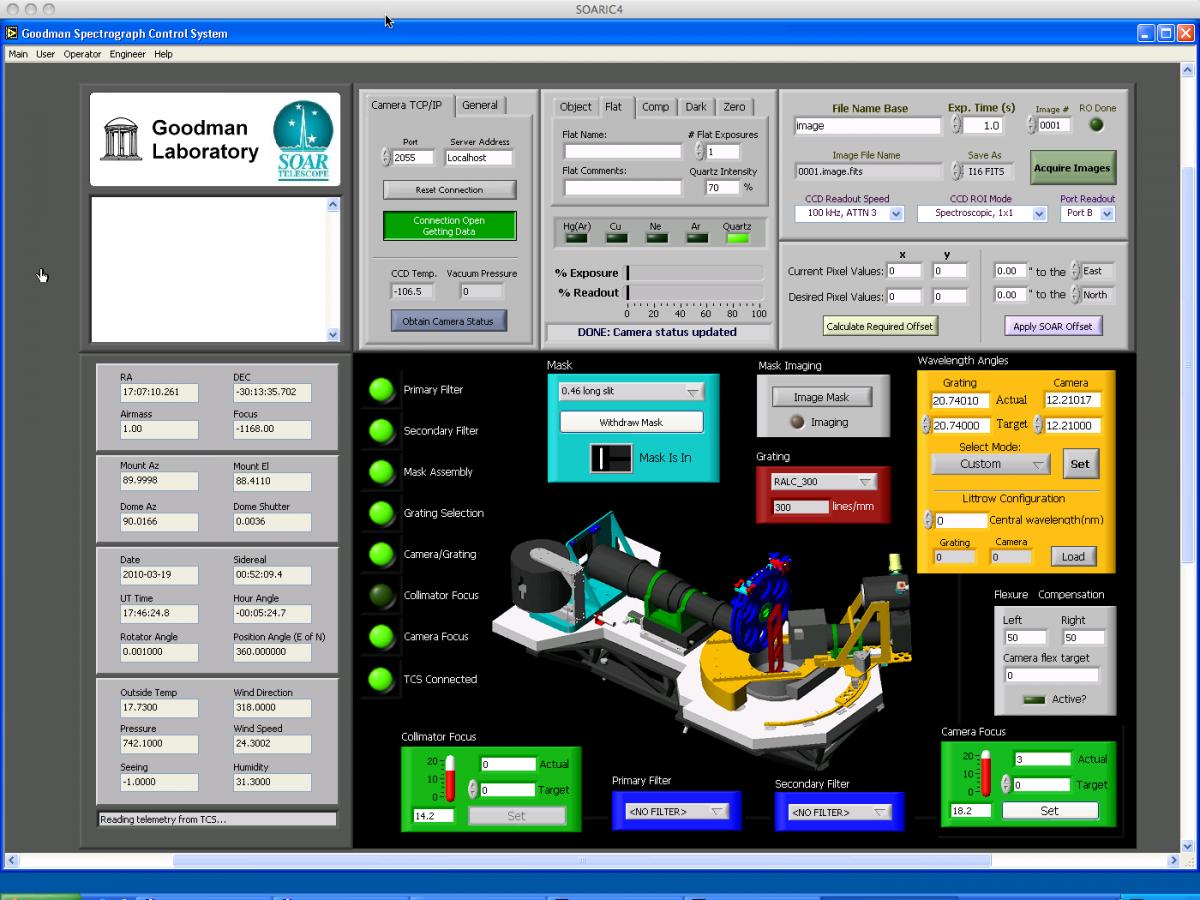
Figure 10: (a) Taking an internal calibration quartz spectrum. In this image the internal quartz lamp is off. (b) Taking an internal lamp quartz spectrum. The quartz lamp has been turned on at the 70% level.
- Change the OBSTYPE (OBJECT, FLAT, COMP, DARK, or ZERO) of the image by clicking on the appropriate tab.
- Edit the "Object Name" for the FITS headers.
- Set the number of exposures for each OBSTYPE.
- Set the base name of the FITS file.
- Set the exposure time.
- Select the CCD binning and image size. The default 1x1 imaging mode has an image size of 3096x3096 pixels. The default 1x1 spectroscopic mode has an image size of 4142x1896 pixels. Please note that no overscan region is written for imaging mode. The overscan region is only read if the serial dimension is greater than 4096 pixels.
- Select the CCD readout speed, gain and readnoise parameters.
- Turn on/off calibration lamps (HgAr, CuHeAr, Ne, Ar, Quartz). For example, select the "Flat" tab in the "Acquisition and Exposure Status" region of the GUI (see Figure 10). All of the calibration lamp LEDs should be dark green (Figure 10a). If you are using the internal quartz lamp, select the desired intensity value and then click the dark green box beneath the "Quartz" label. The dark green box should now be bright green (Figure 10b). You should always check with the telescope operators that the calibration lamp has been turned on.
- Make a telescope offset.
- View the exposure time and readout status.
All of these features are discussed in more detail in the Observing with Goodman section of this manual.
- Instrument Status Region - This region of the GUI is equal in its complexity as the Acquisition and Exposure Status Region. In this section, the observer controls the physical setup of the spectrograph. In this region, the observer can do the following:
Figure 16: Selecting the camera focus. The set camera focus region is located in the bottom right-hand corner of the GUI. To change the camera focus, the observer should change the "Target" value to the desired camera focus and then press the "Set" button.
- Check on the status of the motor sub-systems. This is indicated by the vertical column of round lights (LEDs) on the left of the display. If the lights are bright green, it signifies that the sus-systems are homed and/or in their proper positions as determined by the sub-displays in this region. If the lights are dark green, it indicates that the sub-system has not been homed. At present, only the status light for the Collimator Focus should be dark green (see below). If the status light is yellow, it signifies that the sub-system is moving from one state to another. For example, if you change the Slit Mask from the 0.46" slit to the 1.03" slit, the light to the left of "Mask Assembly" will change from bright green to yellow and then back to bright green during the exchange of slit masks. If a motor light should be red, it indicates that an error has occurred and that the observer needs to shutdown the Data Acquisition GUI and restarted after the power to the instrument electronics box has been cycled.
- Change the "Primary Filter". The Goodman filter wheels can hold 5 +1 (empty) 4" diameter filters. We have placed UBVR filters on the Kron-Cousins system in the primary filter wheel on Goodman (see Figure 11).
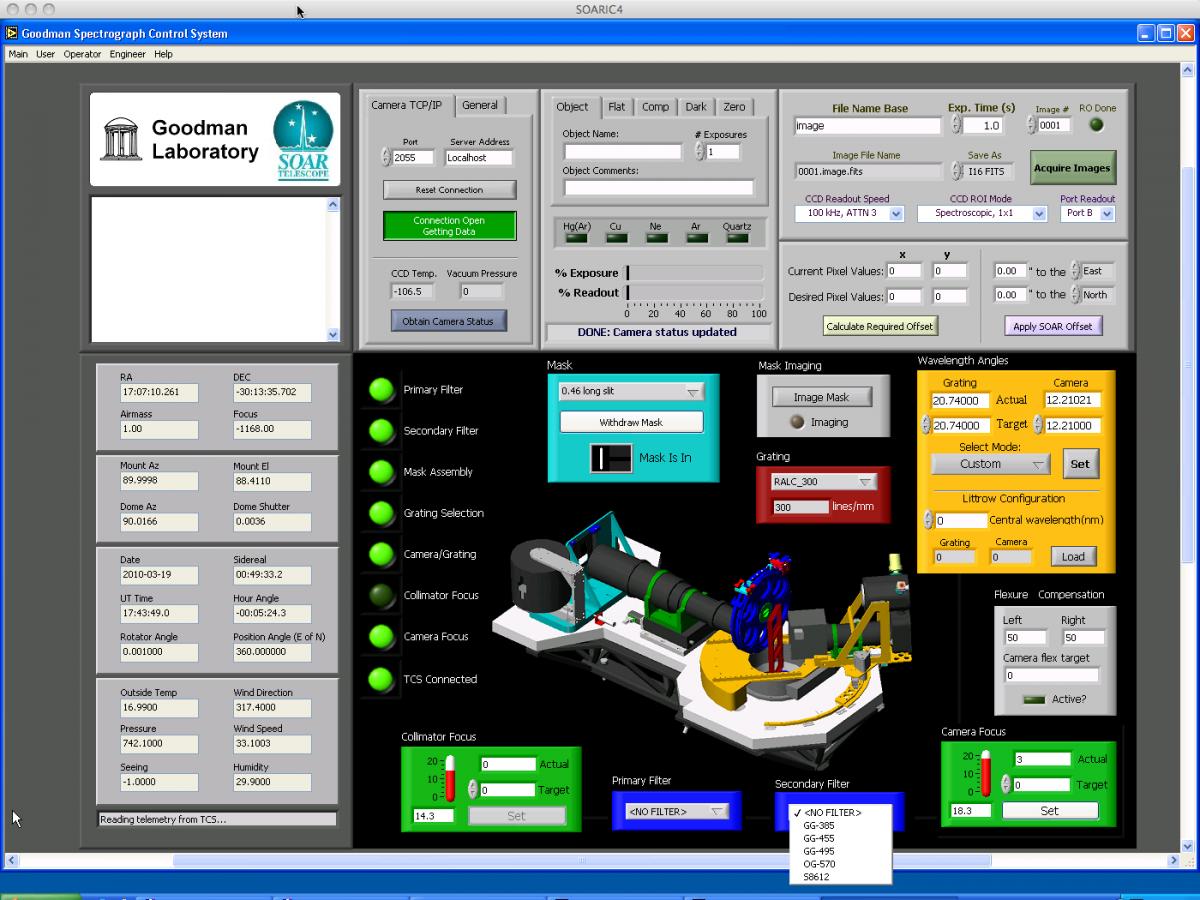
- Change the "Secondary Filter". The Goodman filter wheels can hold 5 + 1 (empty) 4" diameter filters. We have placed GG-385, GG-455, GG-495, and OG-570 order blocking filters in the secondary filter wheel.
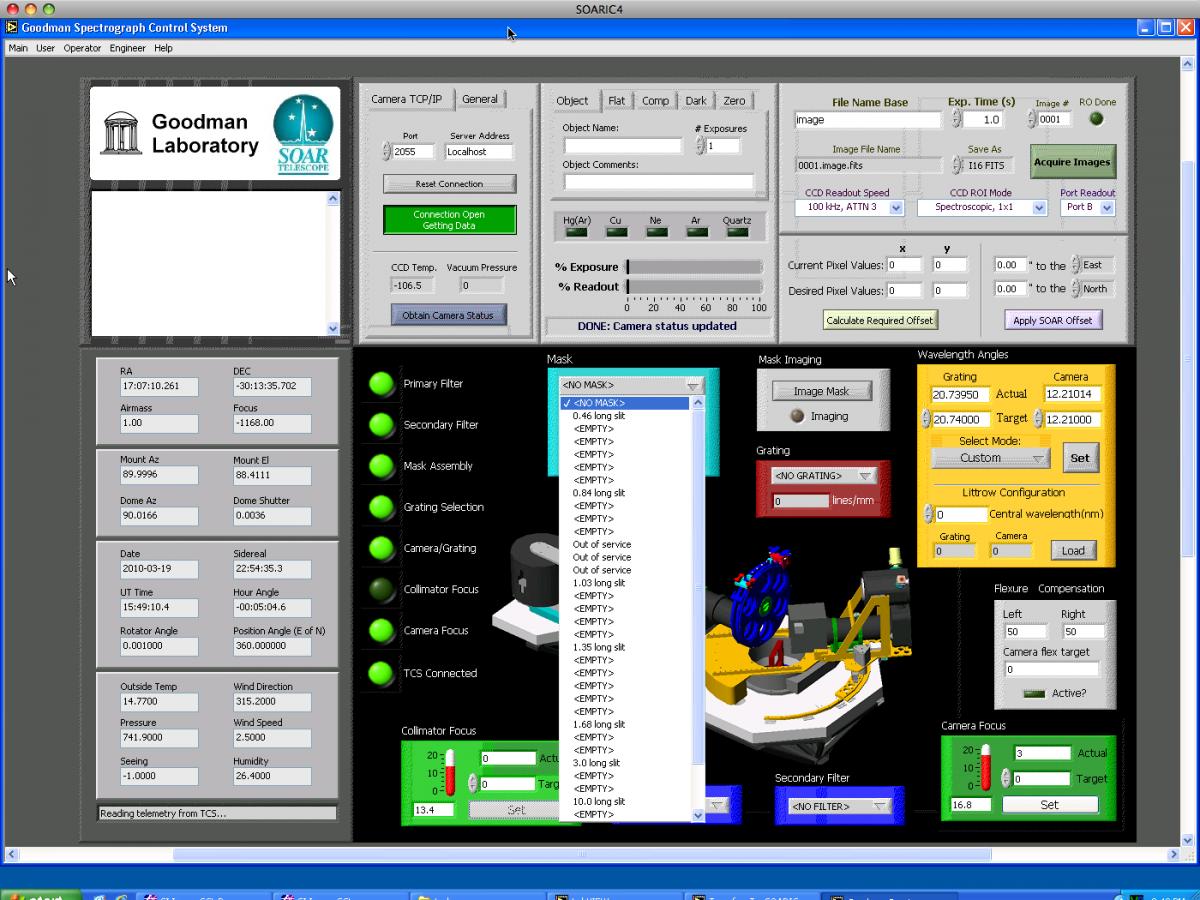
- Change the "Slit Mask". An observer can change the Slit Mask from that which is currently in place by clicking on the upper-most button under the "Mask" section of the GUI and select a different slit mask (see Figure 13). After a successful startup of the GUI no slit mask will be in place. The observer should then choose from among our current long-slit masks as given in the Goodman Overview.
- Change the "Grating". An observer can choose from no grating, to any of the maximum of three gratings that can be installed at a given time, e.g., the 400l/mm, 600l/mm, or 1200l/mm by clicking on the grating selection button. For the updated list of available gratings see the Goodman Overview page.
- Select the "Camera and Grating" angles for the observations. This feature allows the observer to select among the various predetermined spectroscopic modes of the instrument (see Figure 15). These modes are listed in the Goodman Overview section of this manual. We provide examples of HgAr and CuHeAr spectra in the Comparison Lamp section of the Goodman documentation.
- The "Camera Focus" depends upon the observing setup that the observer chooses. The TelOps staff have a list of the most recent camera foci that have been determined during an engineering run. If in doubt, the observer should determine the best camera foci for their run during afternoon calibrations. More information on determining the camera focus is given in the User's Guide to Observing with Goodman. and the page on determining focus in imaging mode.
Updated on April 18, 2024, 10:14 am
