Filter Transmission setup
Contents:
- Description
- Transmission Measurement Procedure
- Instructions for plotting nice graphs
- Tricks for the measurements
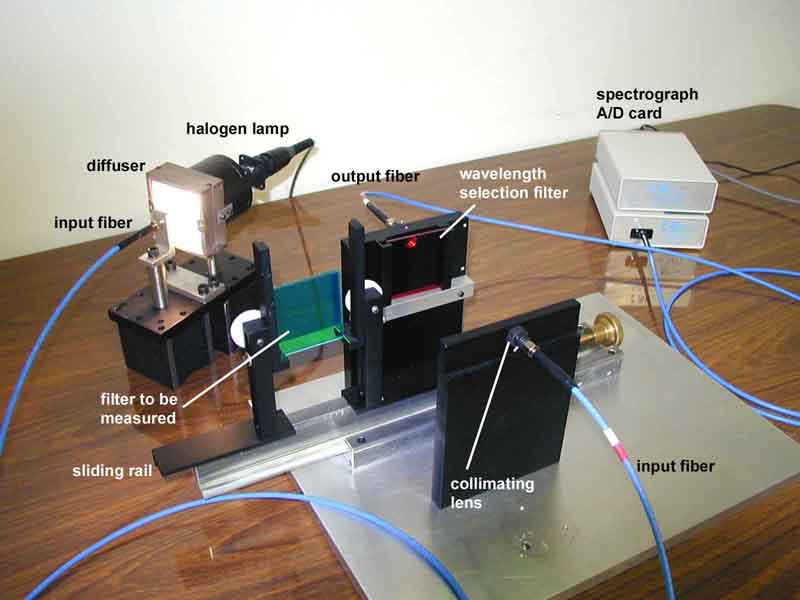
During January 2001, a new setup was assembled to measure filter transmission on Cerro Tololo . Any thickness, shape and size of filters up to 6x6" can be measured.
Description
The S2000 is a miniature fiber optics spectrometer made by Ocean Optics with grating of 600 lines/mm blazed for 750 nm, configured for spectral range of 600-1200 nm, with 10um wide slit and long pass filter (305nm) permanently installed. UV2, a UV detector upgrade for application < 360 nm, and L2, a detector collecting lens of fused silica for increased light collector efficiency, were also requested from Ocean Optics. Fiber optics with 400um core diameter are used.
- Dispersion: 0.3 (nm/pixel).
- Resolution: 3.2 pixel.
- Optical Resolution = dispersion x resolution = 0.96 nm FWHM.
The fiber optics spectrometer S2000 is a crossed Czerny-Turner design, with no moving parts. The basic characteristic of the Czerny-Turner mount is to use two identical off-axis concave spherical mirrors as the collimating and focusing elements, with the important property of canceling the coma aberration that is inherent with spherical mirrors and which otherwise inhibit resolution.

Light enters the optical fiber and is efficiently transmitted to the spectrometer. Once in the spectrometer, a spherical mirror collimates the divergent light emerging from the optical fiber. A plane grating diffracts the collimated light, the resulting diffracted light is focused by a second spherical mirror. An image of the spectrum is projected onto a 1 x 2048 linear CCD array, and the data is transferred to a computer through an A/D card.
The light source used is a halogen lamp with a quartz bulb (General Electric 787, same as the ones used for the 4m dome flat lights), that we feed with a stabilized power supply at 7V (1.77 A). A ground glass in front of the lamp is used to create a diffuse source.
The Spectrometer comes with the OOIBase32 software, which is the spectrometer operation software. From time to time it is necessary to check the calibration of the spectrometer's wavelength. For this we use a light source that produces known spectral lines, in our case Ocean Optics' HG-1 Mercury-Argon lamp. We did that calibration in Jan 2001 and found the following parameters:
- 1st coefficient: 0.36780
- 2nd coefficient: -2.3734 e -5
- 3rd coefficient: -1.5193 e -9
- Intercept: 589.99860
which produced a maximal residual error of 0.2 nm. Follow the guideline in the help menu to perform the calibration.
Transmission Measurement Procedure
- In scope mode
 , press
  to take a spectrum of the light source, adjusting integration time (1) until you get about 3000 count maximum.
 - Make sure you are using the proper selection filter
- Take a Global Reference
 (on first icon line)
 - Block the light going into the fiber connected to the spectrometer, press , wait until you see a trace at the zero level and take a Global Dark
 (on first icon line)
 - Select Transmission mode

- Take a local reference (on second icon line): you should then see a flat line at 100 % (maybe with some isolated vertical lines, if not go back to Scope mode and retry).
- Slide the filter in the beam
- Press and the absolute transmission curve should appear.
- To save, select in the menu: File | Save | Processed.
Notes:
1. The longer the integration time, the slower the system refresh time. At about 500ms, it is already noticeably slow, at 1sec integration time, it becomes terribly slow and sometimes fails. Whenever the software freezes, you need to exit the program, cycle the spectrometer power and start again.
2. In each step make sure the data is well taken by watching out the status message (should say 'Ready').
3. Use average (5 to 10) if the signal is noisy. References, dark and measurements must be taken under same conditions (integration, average,...)
Instructions for plotting nice graphs
For data processing we recommend to use Microcal Origin Software. This software has useful functions (like smoothing and Gaussian Fit that Excel doesn't have as readily).
* Import the file saved by OOIBase to an Origin worksheet. Select File | Import | ASCII select the *.* extension.
* Plot the data: Plot and select the type of plot you want. We suggest 'Line'.
* Choose your column variables for the X and Y axes.
* You can re-scale the Graph by clicking the axes or choosing Graph.
* You can always add new columns in the table selecting the Columns menu. Handling the columns of numbers is very similar to what is done with Excel.
For some plots it will be useful to use the "Smoothing" or "Fit as Gaussian" options. For Smoothing activate the Graph and select: Analysis | Smoothing | Adjacent Averaging. This opens the Smooth Points dialog box were you specify the variable that control the degree of smoothing. The smoothed value at index i is the average of data points in the interval [i-(n-1)/2 , i + (n-1)/2]. Increase the degree of smoothing until you get satisfactory results (20 is usually enough). Then plot again choosing as new variable the smoothed column.
To fit Gaussian select Analysis | Fit Gaussian. That function is useful especially for narrow band filters to avoid the triangular peak that usually shows up because of the finite resolution. Make sure the fit is good, ie. the peak, Fwhm and slopes are not affected in the process.
Worksheet and graph may be exported to another applications by creating an export file. Activate the data table and select File | Export ASCII. If you want to export the Graph, select File | Export Page and choose the file type you want to export.
To save select File | Save Project As
Tricks for the measurements
In all measurements, you need a wavelength selection filter to separate the orders. In general we use two selection filters: Corion short wave pass LS 550 (plot and data) and Schott long wave pass OG 590.
* For all filters with transmission range above 590 nm, you will see the transmission in first order directly and need to use OG 590.
* For all filters with transmission range below 550 nm, you will see the transmission in second order and need to use LS 550 (and divide the wavelength obtained by two).
* For all filters with transmission range around 550-590 nm, you need to make 2 sets of data, one with the LS600 selection filter and possibly one with the OG590 selection filter, then stitch together the results to obtain a single graph. Usually the resulting graph has some noise at the union, so you need to smooth it.
* For blue filters, you might want to use the Bj filter for better transmission (less noise at 3300 A).
* For measurements near the atmospheric cutoff at 330nm, use the UVpass Corion filter (see plot)
Measuring a filter against itself will show you a line at 100% in the useful transmission range of the filter and increasing noise outside that range, which is sometimes useful to assess the bandpass width of the filter in order to select the most appropriate wavelength selection filter for the absolute transmission measurement.
Written by Constanza Araujo (optics student at the Catholic University of Vaparaiso), 1 February 2001.
Updated on April 15, 2024, 5:20 am