The SOI Software
Logging on to the Data Acquisition and Data Analysis Computer
The data acquisition and preliminary reduction computer is called soaric1. A number of different ways to logon to this machine exist, depending upon your preference. These methods are discussed below.
- From Cerro Pachón:
- The mountain staff or your support scientist will show you the computer on which you can obtain and analyze your data. To open the SOI user control panels:
- Double click on the "Scroll Lock" Key
- A window will open displaying the names of the computers to which you can connect
- Use the "Up" and "Down" arrow keys to highlight "SOI 1 ic1" and press "ENTER/RETURN"
- If the Data Acquisition and Analysis windows are running, you can skip to the GUI Layout section of this manual. If these GUIs are not running, skip to the Starting and Stopping the Data Acquisition GUI and Starting and Stopping the Data Analysis GUI sections of this Manual.
- The mountain staff or your support scientist will show you the computer on which you can obtain and analyze your data. To open the SOI user control panels:
- From the Remote Observing Center in La Serena:
- Log on to the SOI account using the username and password provided to you by the instrument scientist (Sean Points). If forgotten, these are posted on a list near the door.
- Start the Data Acquisition GUI by typing the following command from a terminal command line on the GNU/Linux computer in the remote observing center:
- > vncviewer -Shared soaric1.ctio.noao.edu:9 &
Log on to the vncviewer with the password provided by the instrument scientist. - Start the Data Analysis GUI by typing the following command from a terminal command line on the GNU/Linux computer in the remote observing center:
- > vncviewer -Shared soaric1.ctio.noao.edu:8 &
Log on to the vncviewer with the password provided by the instrument scientist.
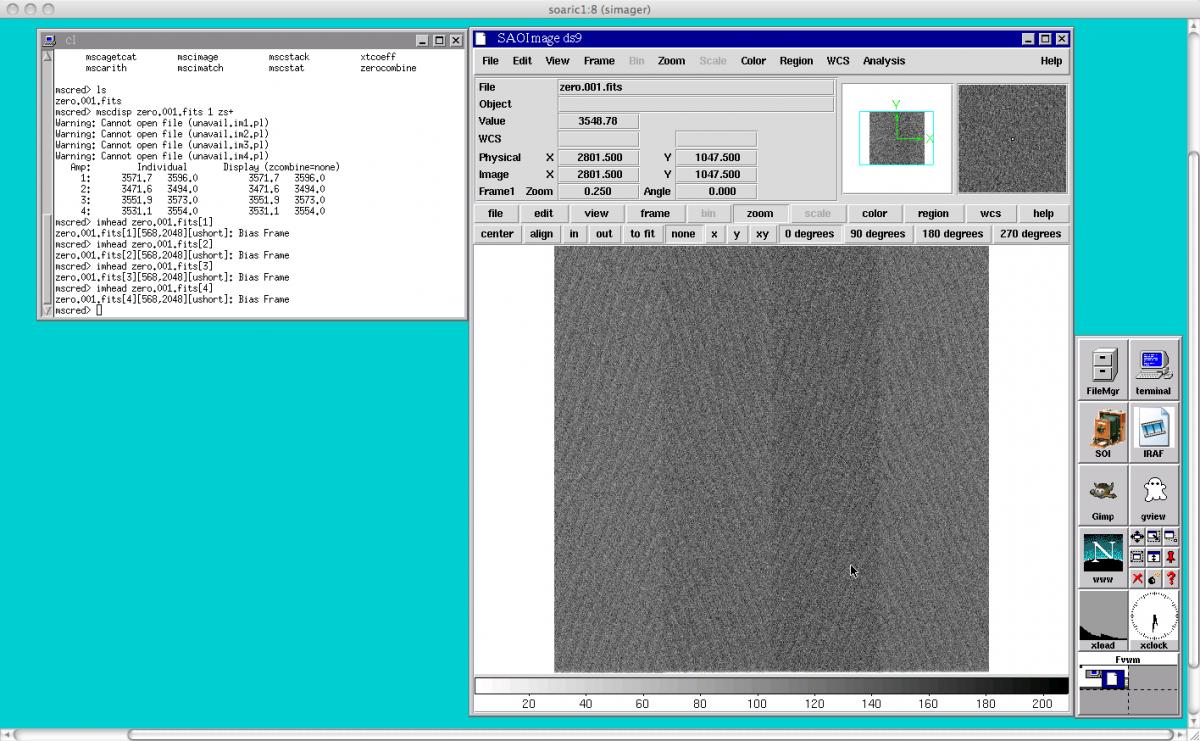
In most cases the GUIs should be started and you will be presented with a data acquisition screen and data analysis screen as shown in Figure 5.
Figure 5: The SOI Data Acquisition and Data Analysis GUI windows.
Starting and Stopping the Data Acquisition GUI
If the data acquisition GUI has not been started, then one should see a light blue screen in the soaric1:9 VNC window with an xload and xclock window that has 8 buttons labeled FileMgr, terminal, SOI, IRAF, Gimp, gview, www, and some window manager utilities. To start the data acquisition software:
- Single click on the 'SOI' button. This will pop up the SOIGUI_GuiLogic window.
- On the SOIGUI_GuiLogic window, there are 3 buttons in the upper right-hand corner labeled Init Ctrl, Rel Ctrl, and EXIT.
- To the immediate left of these buttons are various instrument status indicators. If the startup has been successful, all of the instrument status lights should be a bright green. If any of these lights are red, the most probable cause is that the Leach Controller is not initialized. To initialize the controller, press the "Init Ctrl" button. After a few seconds, all of the indicator lights should be bright green.
- You are now ready to operate SOI.
If the data acquisition GUI needs to be stopped:
- Single click on the 'EXIT' button in the upper right-hand side of the data acquisition GUI.
- Under most normal cases, the GUI will close automatically and nothing else remains to be done.
- In certain cases, a window will appear and ask if you want to shutdown the LabView application. This window consists of a toggle switch labeled "Exit Labview". Click on the toggle switch so that it is in the down position. Then click on the "File" tab in that window and "Quit" LabView. After this, all of the LabView windows should close.
Starting and Stopping the Data Analysis GUI
The SOI data analysis VNC window (soaric1:8) has the same base layout as the SOI data acquisition VNC window (soaric1:9). If the data analysis windows are not up, you will see the xload window and the accompanying buttons described in the data acquisition GUI startup section. Single click on the IRAF button and an IRAF window will open. You will want to open a DS9 window from within IRAF and load the mscred IRAF package.
Basic GUI Layout
All observing with the SOAR Optical Imager (SOI) is handled through the Data Acquisition GUI. Upon successful startup of the SOI data acquisition GUI on soaric1:9, one should see that the SOI data acquisition window looks something like that shown in Figure 5.
The SOI observing GUI can be divided into certain distinct regions as shown in Figure 6. These include the:
Figure 6: The SOI data acquisition GUI with regions demarcated and labeled.
- Connection Status Region - This region of the GUI shows the local time in La Serena and the connection status of the instrument. After a successful startup of the GUI, all of the indicator lights toward the right-hand side should be a bright green. If they are not, you will first want to check if the Leach Controller has been initialized. You can initialize the Leach controller by clicking the "Init Ctrl" button. If lights remain red after initializing the controller, you may want to exit the GUI and restart. The Telescope Operations staff or your Observing Support Astronomer can help you with this.
- Instrument and TCS Status Region - This region shows various telemetry data from the instrument, as well as information obtained from the Telescope Control System (TCS). These data include the current RA and Dec, the airmass, the sidereal time, etc.
- Exposure Status Region - The Exposure Status Region provides information about the current exposure or sequence of exposures. If a sequence of exposures is being acquired, it shows how many of the current exposures have been completed in the uppermost status bar. Below that, there are counters that show how long the observation has been integrating and if the observation has been paused for any reason. Further down, this section of the GUI shows what the exposure time, i.e., how long the shutter will be open. Finally, this section of the GUI shows the readout and writeout progress of the current exposure.
- CCD Geometry Region - This region lies to the immediate right of the Exposure Status Region. Its primary purpose is to allow the observer to see the current readout mode and binning of the SOI CCDs. Furthermore, it alerts the observer if the a region-of-interest has been defined (i.e., only a section of the CCDs will readout), if the automatic image display feature is enabled for the SOI Data Analysis GUI, and if the observer is using the observing grid mode. If any of these features are enabled, the indicator lights in this section of the GUI will be bright green instead of the nominal dark green. These features will be discussed in more detail in the Advanced Tools section below.
- Directory and Filename Status Region - This region of the GUI lies below the Exposure Status and Geometry Status sections. They basically allow the observer to set the (1) directory in which the data will be written, (2) change the base filename of an image, and (3) change the sequence number of the observation. In standard practice, the directory path for data obtained by visiting NOAO observers is:
- Data Acquisition Region - This section of the Data Acquisition GUI lies toward the bottom of the display and essentially reflects the nuts and bolts of the image acquisition procedure. This section of the GUI allows the observer to select the OBSTYPE of an image. The currently defined OBSTYPEs are:
- ZERO
- OBJECT
- DARK
- DFLAT
- SFLAT
These OBSTYPEs can be chosen by clicking on the appropriate tab in the upper left-hand side of this section of the GUI. In general, these tabs allow an observer to input the image title and an additional comment to the FITS header. All of the tabs that permit an observer to change the OBSTYPE of an image allow the observer to also change the exposure time of the image, except for a ZERO or Bias Frame observation. Furthermore, if the OBSTYPE is selected to be a DFLAT (Dome Flat), the observer is allowed to turn on and set the intensity of the White Spot Lamps. The Telescope Operators can provide you with the correct intensity values and exposure times for your Dome Flat observations. The "Misc" and "Focus" tabs in the Data Acquisition Region are not currently supported.
Also included in the Data Acquisition section of the SOI GUI are the Start, Pause, Stop, and Abort buttons. Pressing the "Start" button will begin the process of taking an exposure of the currently selected OBSTYPE. During an exposure, one may also click on the "Pause", "Stop", or "Abort" buttons. The "Pause" button will suspend an ongoing exposure until the "Resume" button is clicked. During this time, the shutter should close so that the detectors are no longer integrating on the sky, but the detectors will continue to accumulate cosmic ray hits and dark current. Upon clicking the "Resume" button, the shutter will open and the exposure will proceed as scheduled. Clicking the "Stop" button during an exposure will close the shutter, readout the CCDs, and write the data to the disk. Clicking the "Abort" button will close the shutter and discard the current image. The "Abort" button does not write data to the disk.
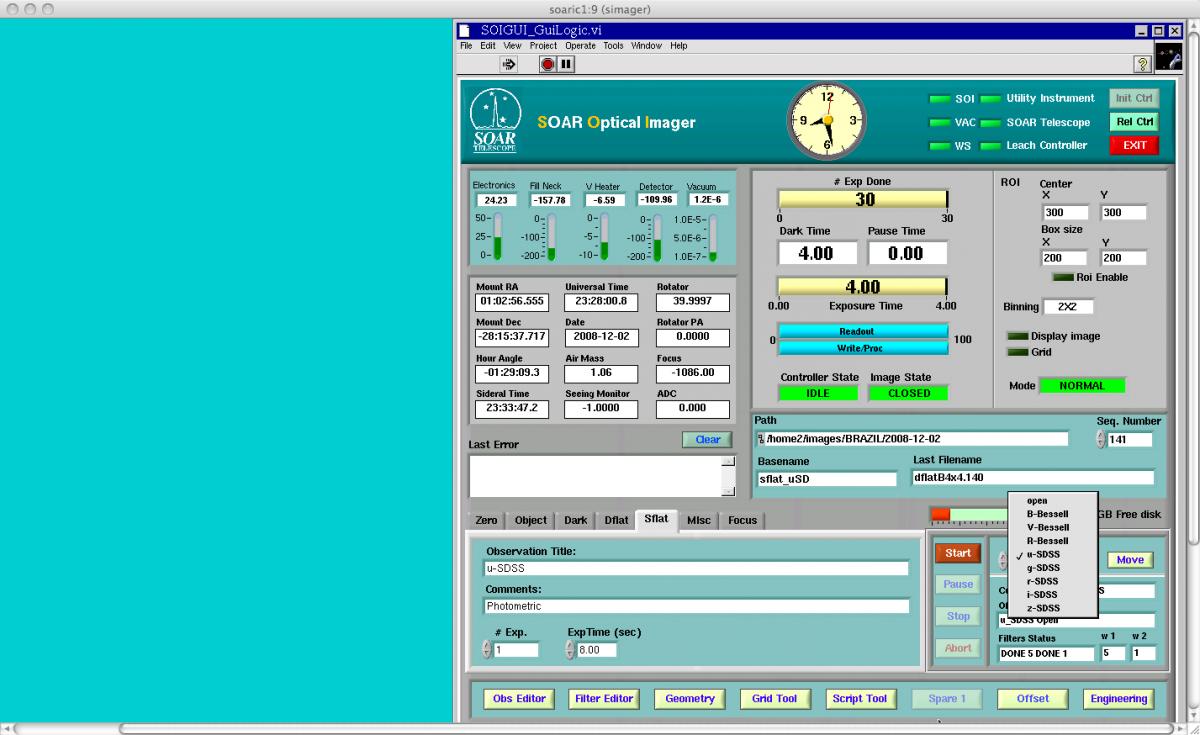
Finally, on the right-hand side of the Data Acquisition Region, the observer can select the filter to used during the current observation. To change a filter:
Figure 7: The SOI filter select interface.
- Click on the dialog box below the "Filters List"
- A list should open that will allow you to choose the filter to be used. Simply click on the filter you wish to use. A checkmark should appear on the left-hand side of the filter designation. As shown in Figure 7, the u-SDSS filter has been selected.
- After selecting the appropriate filter, click the filter "Move" button
- One should see the "Filter Status" display go to "Active" while the filter wheels are moving. Once the filter change is complete the "Current Filter" value should be the same as the "Filters List" value; the "Official Name" value should also reflect this change; and the "Filter Status" should change from "Active" to "Done".
- Advanced Tools Region - This section allows the observer more enhanced control of the SOAR Optical Imager. In this region the observer is able to use the:
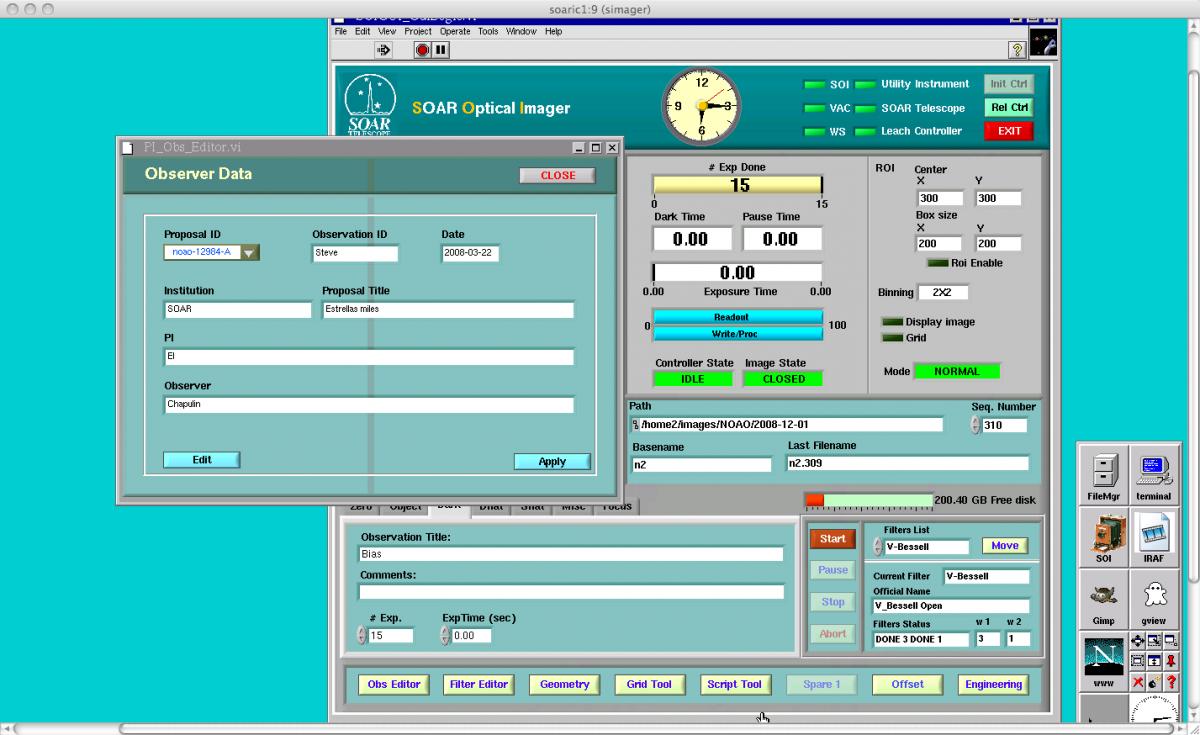
- The Obs Editor allows the observer to change the Proposal Specific data such as, Proposal ID, Observation ID, Date, Institution, Proposal PI, and Observer, as shown in Figure 8. If you need to edit the values in the given fields, click on the "Edit" button. Once you have finished editing the fields, click on the "Apply" button and "Close" the window.
Figure 8: The SOI Observer Information interface.
- The Filter Editor changes the designations of the installed filters. At present, the TelOps staff will change these for you. Visiting observers SHOULD NOT use the Filter Editor. The filter editor is shown in Figure 9.
Figure 9: The SOI Filter Editor interface.
- The Geometry Editor changes the readout section of the CCDs. It allows an observer to change the binning and select regions-of-interest. The standard SOI binning is 2x2 so that one has ~0.15"x0.15" pixels. The SOI Geometry Editor, shown in Figure 10, allows one to change binning and Region-of-Interest readout of the CCDs.
Figure 10: The SOI Geometry Editor interface.
To change the binning, click on the Binning "Select" Box. The available options will be shown to you. To finalize your binning selection, click the "Apply" button to the right of the selection box. You should notice that Binning indicator in the Geometry Status section of the GUI flashes from yellow to red during this change. The background of the Binning indicator will remain white after the binning has successfully changed.
To change the Region-of-Interest (ROI) readout of the CCDs, one must first enable the ROI dialog by clicking on the "ROI Enable" button on the Geometry Editor screen. After pressing the ROI button, you can enter the detector coordinates (x,y) and the size in (x,y) of the ROI. The detector coordinates are related to the current binning. Thus, for a 2x2 binned observation, the center of the detector is at (x,y) = (1024,1024).
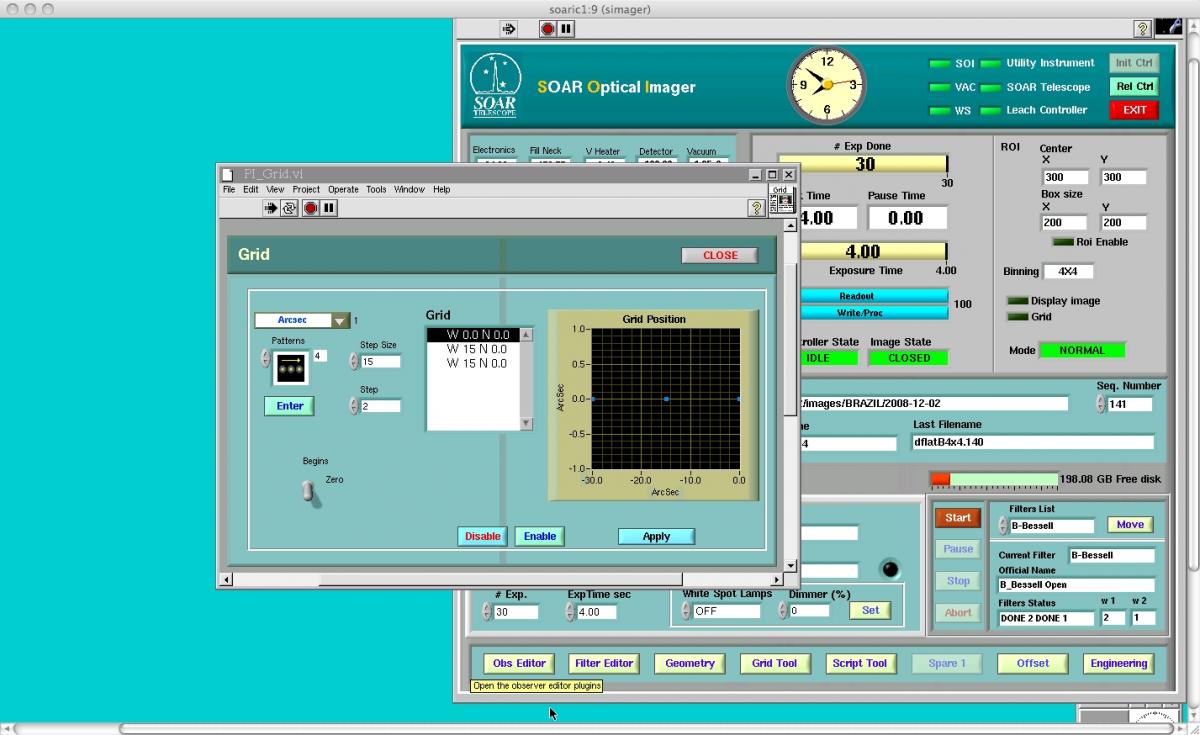
- The Grid Tool allows the Visiting Astronomer to use certain pre-defined dithering patterns either in pixel or RA/Dec coordinates. To use the Grid Tool, click on the Grid Tool button in the Advanced Tools Region of the GUI. Select the mode with which you want to execute your dither patterns (i.e., pixels or arcsec; Note: only RA and Dec offsets in arcsecs are supported at this time) by highlighting the appropriate tab in the upper left-hand corner of the Grid Tool, as seen the left-hand side of Figure 11. Choose a dither pattern by selecting the "Pattern" dialog box as shown in the right-hand side of Figure 11. The current pre-defined patterns are:
- Pattern 0 (NW) - This dither pattern performs telescope offsets to the North and West of the current position.
- Pattern 1 (SE) - This dither pattern performs telescope offsets to the South and East of the current position.
- Pattern 2 (SW) - This dither pattern performs telescope offsets to the South and West of the current position.
- Pattern 3 (NE) - This dither patter perfroms telescope offsets to the North and East of the current position.
- Pattern 4 (W) - This dither pattern performs telescope offsets to the West of the current position.
- Pattern 5 (E) - This dither pattern performs telescope offsets to the East of the current position.
- Pattern 6 (N) - This dither pattern performs telescope offsets to the North of the current position.
- Pattern 7 (S) - This dither pattern performs telescope offsets to the South of the current position.
- Pattern 8 (NSEW) - This dither pattern performs telescope offsets in a classic grid.
- The Obs Editor allows the observer to change the Proposal Specific data such as, Proposal ID, Observation ID, Date, Institution, Proposal PI, and Observer, as shown in Figure 8. If you need to edit the values in the given fields, click on the "Edit" button. Once you have finished editing the fields, click on the "Apply" button and "Close" the window.
Figure 11 : The SOI Grid Tool Interface.
-
In order to apply a a dither pattern to the Grid Tool, one should
-
- Select the Grid Tool mode (arcsec).
- Select the grid pattern (see above).
- Enter the step size for the units selected above (e.g., 15" according to the left-hand side of Figure 11.).
- Enter the number of steps to complete. As this tool is currently implemented, the current position of the telescope is assumed to be the 0th step of the grid. That is, if as in the example shown in left-hand side of Figure 11, entering "2" into the "Step" box of the the Grid Tool will perform a 3-point dither with the current telescope position being the 0th dither point, a 15" W offset being the 1st dither point, and another 15" W offset being the 2nd dither point. Thus, one thing to note is that subsequent dithers with this tool are relative and not absolute.
- In order to calculate the currently selected dither pattern, click on the "Enter" button below the grid pattern editor.
- To Enable the Grid Tool for observations, click on the "Enable" button in the bottom center of the Grid Tool.
- To Apply the currently selected dither pattern to the next observation, click the "Apply" button.
- That is to say, in order to perform a pre-definded dither pattern, one should: (1) select the arcsec Grid Tool mode; (2) determine the Grid Tool step size; (3) choose a grid pattern; (4) choose a number of grid steps; (5) click the "Enter" button; (6) Enable the Grid Tool (the grid light should light next to the left-hand side of the "Grid" indicator in the "Geometry Status" section of the GUI); and apply the grid for the observartions that will be taken upon clicking the "Start" button.
-
-
- The Script Tool is currently undergoing Engineering tests. More information about this tool will be released at a later date.
- The Offset and Engineering Tools should not to be used by Visiting Astronomers at this time until more engineering tests are made. As such, nothing will be mentioned of them here.
Observing with SOI
Before Your Run
Prior to your run at SOAR with the Optical Imager, you should have completed the Instrument Setup Form. When using SOI, it is important to send in this form well ahead of time so the proper filters can be installed before your run. In the instrument setup form you can also specify what binning you will use during your run. The default readout is for 2x2 binning with fast readout. Information on the gain settings and readout noise for various binning options under fast readout can be found in the SOI Overview.
In addition to filling out the Instrument Setup Form, visiting observers should read the SOAR Visiting Astronomer´s webpage for general information about traveling to and within Chile. Furthermore, visiting investigators should fill out the Travel Information Question aire so that your transportation and lodgings can be arranged.
Observing logs for your run can be downloaded here.
Setting Up for the Start of Your Night/Run
Before you begin observing with SOI, you should first make sure that the data acquisition GUI and the data analysis GUI are running as shown above in Figure 5. If these GUIs are not running, please refer to the sections of this manual about Starting and Stopping the Data Acquisition GUI and Starting and Stopping the Data Analysis GUI. If you have problems with starting either of these, please contact the Telescope Operators or the SOI instrument scientist (Sean Points). They will be able to help you with this task.
After the GUIs are running, you should check that:
- all of the connection status indicator lights are green
- the binning is set to the proper value (i.e., 1x1, 2x2, or 4x4). Information on how to set the binning is given in the Geometry Editor section if the Basic GUI Layout.
- the correct data acquisition directory is set. This directory must first be created on the file system before it can be set in the GUI. Refer to the Directory and Filename Status region of the Basic GUI Layout section of this manual for more instructions on how to do this if you have problems.
- the filters you requested are installed. You can check which filters are installed by clicking on the Filters List window in the Data Acquisition section of the observing GUI. If the filters you requested are not installed, please contact the Telescope Operations Staff so that they may install the necessary filters.
- the proper observer data has been entered into the Obs Editor section of the data acquisition GUI. This can be done by clicking on the Obs Editor button in the Advanced Tools section of the GUI. After that information has been updated, click on the "Apply" button so that changes will go into effect.
You are now ready to use the SOAR Optical Imager. Information on how to takes exposures can be found in Basic GUI Layout section.
You can also look at the step-by-step SOI Observer's Cookbook for help on observing with SOI
After Your Night/Run
At the end of your observing night, please fill out the End-of-Night (Internal Access Only) report for the telescope. Please make note of any problems that were encountered during the night so that they may be resolved before the next night's observing.
Also, at the end of your night observing with SOI, you may want to transfer your data back to your home institution. To do so, open a Terminal window in either the Data Acquisition GUI or the Data Analysis GUI. Once the Terminal window is open, change directories to where your data are located on soaric1. You may then use scp at the shell prompt to copy the data to your home institution.
After your run is complete, please fill out the End-of-Run report (Internal Access Only).
Updated on January 28, 2025, 11:17 am


