SIFS Characteristics & Performance
This information has been update to reflect status as of August, 2018. Also see the presentation linked from the SIFS main page for further details on the instrument and the data reduction process.
SIFS is an instrument developed and constructed in Brazil for the 4.1-m SOAR telescope by the Laboratório Nacional de Astrofísica (LNA/MCTIC) in collaboration with the Instituto de Astronomia, Geofísica e Ciências Atmosféricas, Universidade de São Paulo (Institute of Astronomy, Geophysics and Atmospheric Sciences of the University of São Paulo, IAG/USP). The instrument consists of three sub-systems: a fore-optics module mounted at the optical Nasmyth focus, a 14-m long optical fiber bundle and a bench spectrograph.
The fore-optics re-images the telescope focal plane onto the input of the integral field unit (IFU) in two interchangeable magnifications: 0.15 arcsec/fiber or 0.30 arcsec/fiber, which produces a field of view of 7.5 x 3.9 arcsec2 and 15 x 7.8 arcsec2, respectively. Only the second configuration is currently supported. The IFU is a two-dimensional array of 1300 microlens (“lenslets”) and optical fibers arranged into a 50-by-26 matrix. The optical fibers in the IFU output are aligned as a pseudo slit at the bench spectrograph entrance. The spectrograph has a set of interchangeable Volume Phase Holographic (VPH) gratings (from 700 to 3000 l/mm) mounted in a rotation stage where is also mounted the camera and the detector. The combination of gratings and camera angles gives a wide range of resolution, 4000 < R < 30000 and central wavelengths. For initial science verification, we are offering a limited selection of these combinations, listed below.
Each fiber projects to 1.9 pixels on the detector array in both the spatial and spectral directions. This means that the fiber spectra on the CCD are very packed in the spatial direction (substantial crosstalk between fibers). For that reason, this instrument has an additional calibration step within the standard procedures to extract the science spectrum. The “extra” calibration frames are a set of 8 masked flat-field images. SIFS has a mask mechanism just in front of the microlens array used to isolate the spectrum of a set of fibers while blocking the light of other neighboring fibers. Moving this mechanism in 8 mask positions it is possible to sample all the 1300 fibers. The SIFS data reduction code simultaneously fits Gaussians to the spatial profiles of group of fibers in order to correct for the crosstalk between the fibers. This code uses as fixed parameters the width and the center position of each fiber spectrum along the dispersion axis, as measured in the masked flat-field frames. The only free parameter for the fit is the Gaussians amplitudes in the science data.
The SIFS detector is a CCD231-84 from E2V, very similar to the SAM and SOI CCDs. These are thinned CCDs, unlike newer deep-depletion detectors, so there will be significant fringing in the far red. The full sensor has a format of 4096 x 4112 pixels, with pixel size of 15μm2. The CCD is operated with a SDSU-3 Leach controller which reads the full un-binned chip in 11s with a noise of 3.9 electrons and a gain of 2.0 e-/ADU. Digital saturation occurs at 65536 ADU. The image is written in a multi-extension FITS file. The basic data reduction is performed using a pipeline developed in PyRAF/MSCRED, which includes bias subtraction, flat-fielding, cosmic rays cleaning and merging the four amplifiers in a single FITS image.
Through semester 2018B, only the 700 l/mm grating has been offered, but as of semester 2019A the 1500 l/mm grating will also be supported (one setting only, however):
Available SIFS Configurations
| 700 l/mm Grating | Dispersion (Å/pix) | Wavelength Coverage | Resolution @5500Å (2 pixels) |
| 700B | 0.69 | 4250Å to 7050Å | 4200 |
| 700M | 0.69 | 4500Å to 7300Å | 4200 |
| 700R | 0.69 | 5000Å to 7800Å | 4200 |
| 1500 l/mm Grating | |||
| 1500M3 | 0.29 | 5560Å to 6730Å | 9500 |
The SIFS overall system efficiency for the 700 l/mm using the Mid setup is shown in the Figure below. The blue line is the efficiency measured using the standard star EG 274 (V = 11.03, DA) and the green line is for HR7950 (V=3.8, A1V). The overall efficiency in this mode is roughly 25-30% that of the Goodman spectrograph with the 930 l/mm gratings, which has a similar spectral resolution with a 0.45 arcsec slit (not allowing for slit losses, which can be significant for a narrow slit).

Radial velocity stability is not well-determined, but commissioning measurements suggest stability of a few km/sec or better during observations.
 .
.

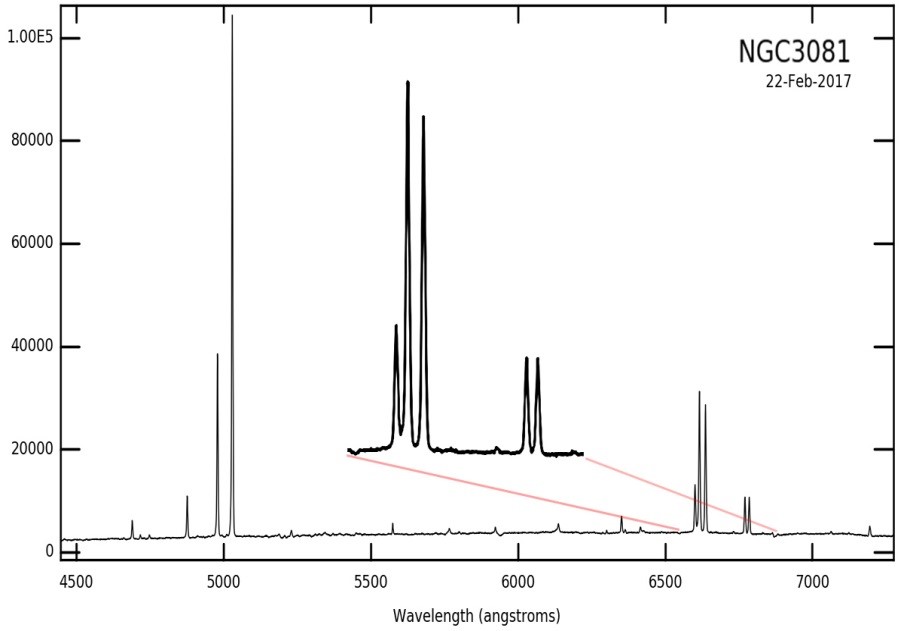
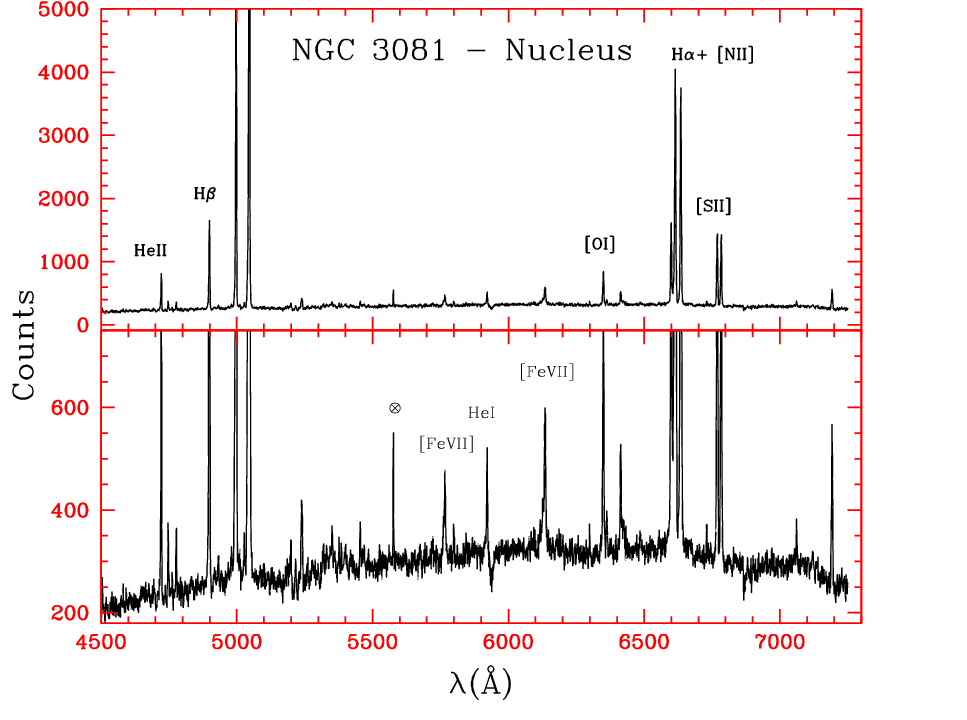
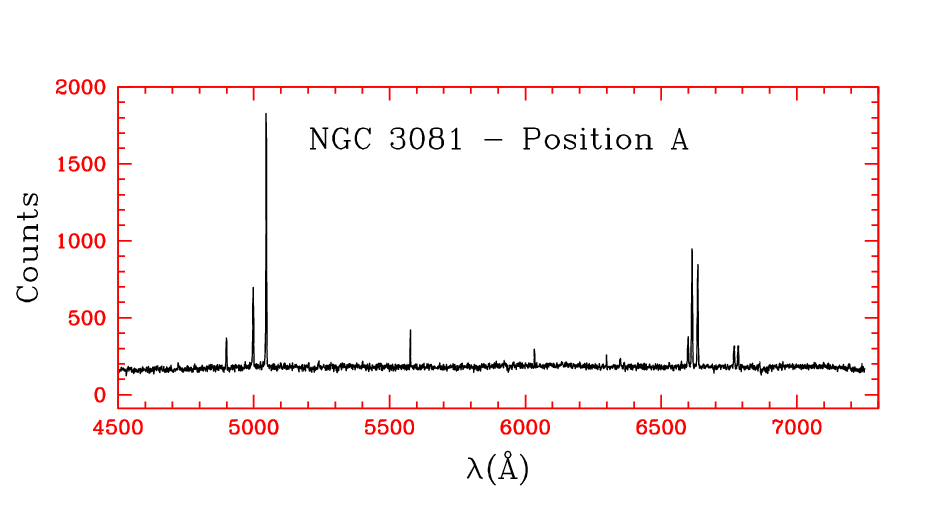
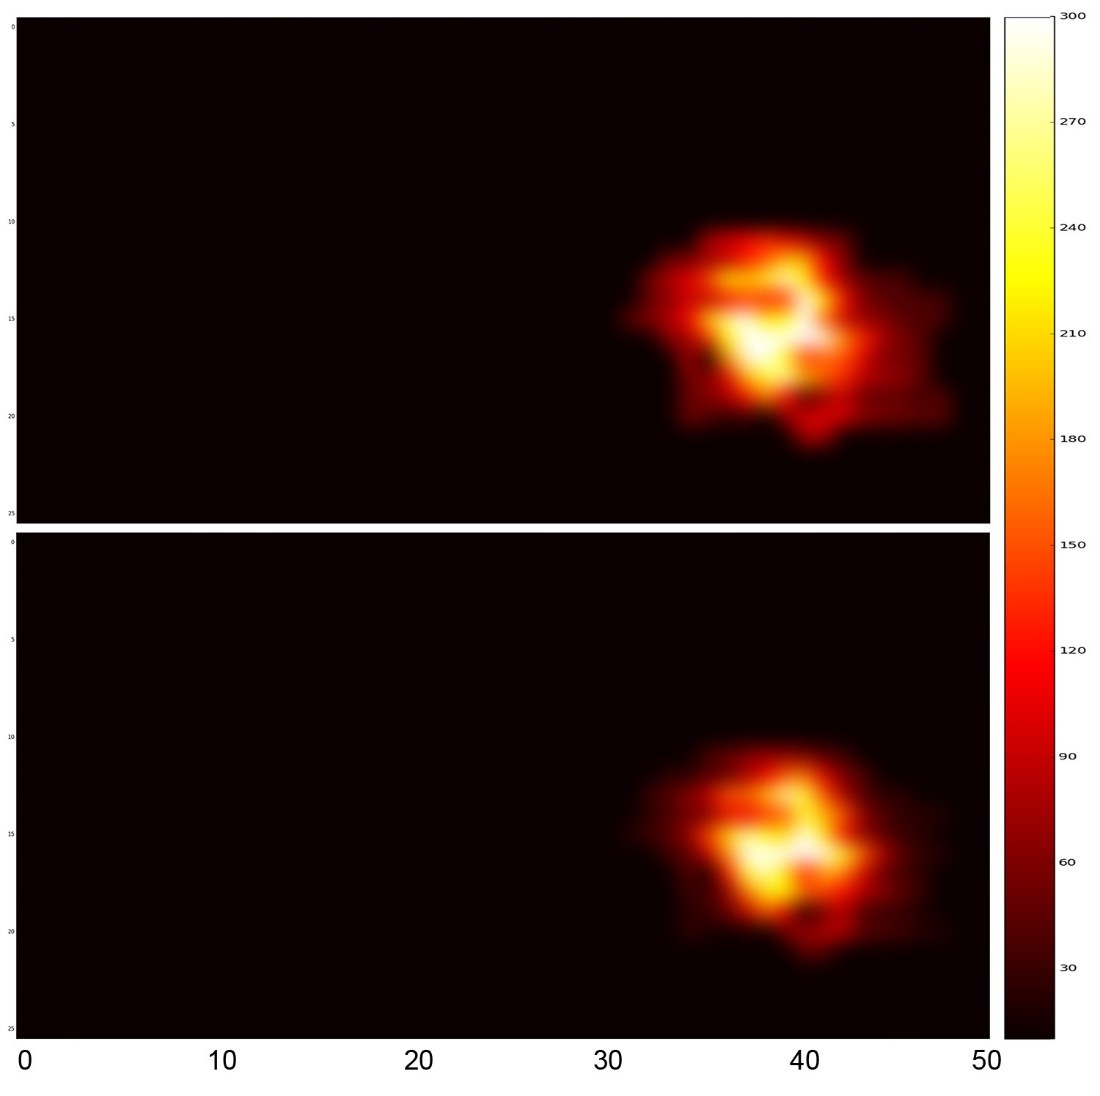
In the figures, we show some spectra obtained with SIFS for the galaxy NGC 3081, all with the 700 l/mm grating centered on 6000 Å, with a single 1200 s integration. The 0.30 arcsec fibers were used. In the top left we display the integrated spectrum of the galaxy. In the top right panel we show the spectrum of the nucleus (expanded scale in bottom panel) for an area of approx. 0.9" in diameter. In the lower panel we show the spectra for an area 0.9” diameter centered on fiber 39,9 (2" south of the galaxy nucleus).) .
Updated on June 24, 2021, 5:36 am
