User Information
- Introduction
- Instrument Description
- Operation
- Performance
- Observing with WTTM
- Observing with Other WIYN Instruments
1. Introduction
The WIYN High-Resolution Infrared Camera (WHIRC) is a near-infrared (0.9 - 2.5 μm) imager which installs on the WIYN Tip/tilt module (WTTM) port. The 0.1 arcsec pixel scale and 3.3 arcmin field of view are designed to take advantage of the excellent native seeing at the WIYN site and the near diffraction-limited image quality (~ 0.2 arcsec) which WTTM is expected to deliver in the 2 micron band. A selection of wide- and narrow-band filters allow WHIRC to achieve a broad range of scientific goals in stellar physics, star-forming regions, and the ISM in galactic and extragalactic sources.
As noted in the current observing information, WHIRC is being offered for the current semester. Operation with WTTM tip/tilt correction is supported and even encouraged, provided that it is compatible with the reference star availability and mapping requirements of the science objectives. Many of the past problems with WTTM now seem to be corrected, and frequent use will help achieve the best performance of WHIRC as well as maintain proficiency of the support staff.
Although the weather severely limited the on-sky time for completing the commissioning effort, WHIRC was finally accepted as a general-use instrument in November 2008. This webpage is intended to give prospective investigators information which is available as a guide for writing proposals and will be updated as information becomes available.
The replacement of the IR Acquisition Board in the MONSOON data acquisition system appears to have largely eliminated the electrical pickup from the instrument rotator motor, resulting in noise performance which meets the acceptance specifications. A revised technique for calculating the conversion gain now results in a value of 3.3 - 3.4 e/ADU, smaller than the previously determined value; we adopt 3.4 as the gain.
Table 1: Useful Facts
| Wavelength Coverage | 900 - 2500 nm |
| Filters | J, H, Ks; 10 narrowband |
| Pixel Scale | 0.0986 arcsec |
| Field of View | 202 x 202 arcsec |
| Detector | Raytheon Virgo HgCdTe, 2048 x 2048 |
| Detector Gain | 3.4 e/ADU (0.7v bias) |
| Read Noise |
~ 9 ADU (30 e) Fowler-1 ~ 5 ADU (17 e) Fowler-4 |
| Full Well | ~ 35000 ADU (119000 e) |
2. Instrument Description
WHIRC is a straight-through all-refractive imager with no moving parts except for the two filter wheels. This design was dictated in part by the stringent instrument envelope and weight requirements of the WTTM port. The optical system consists of a five-element collimator and a five-element camera. A fixed cold stop is located at the pupil image formed by the collimator. The two filter wheels are located on either side of this stop, placing the filters very close to the pupil image. A single LN2 reservoir provides cooling for the optics and the HgCdTe detector, whose temperature is regulated by a servo control loop. The detector controller is the Monsoon system developed at NOAO. Figures 1 and 2 show schematics of the instrument and a close-up of the optical assembly.

Figure 1: Assembly drawing of WHIRC. The shim is used to adjust the axial location of WHIRC so that the WTTM focal plane is imaged onto the detector.
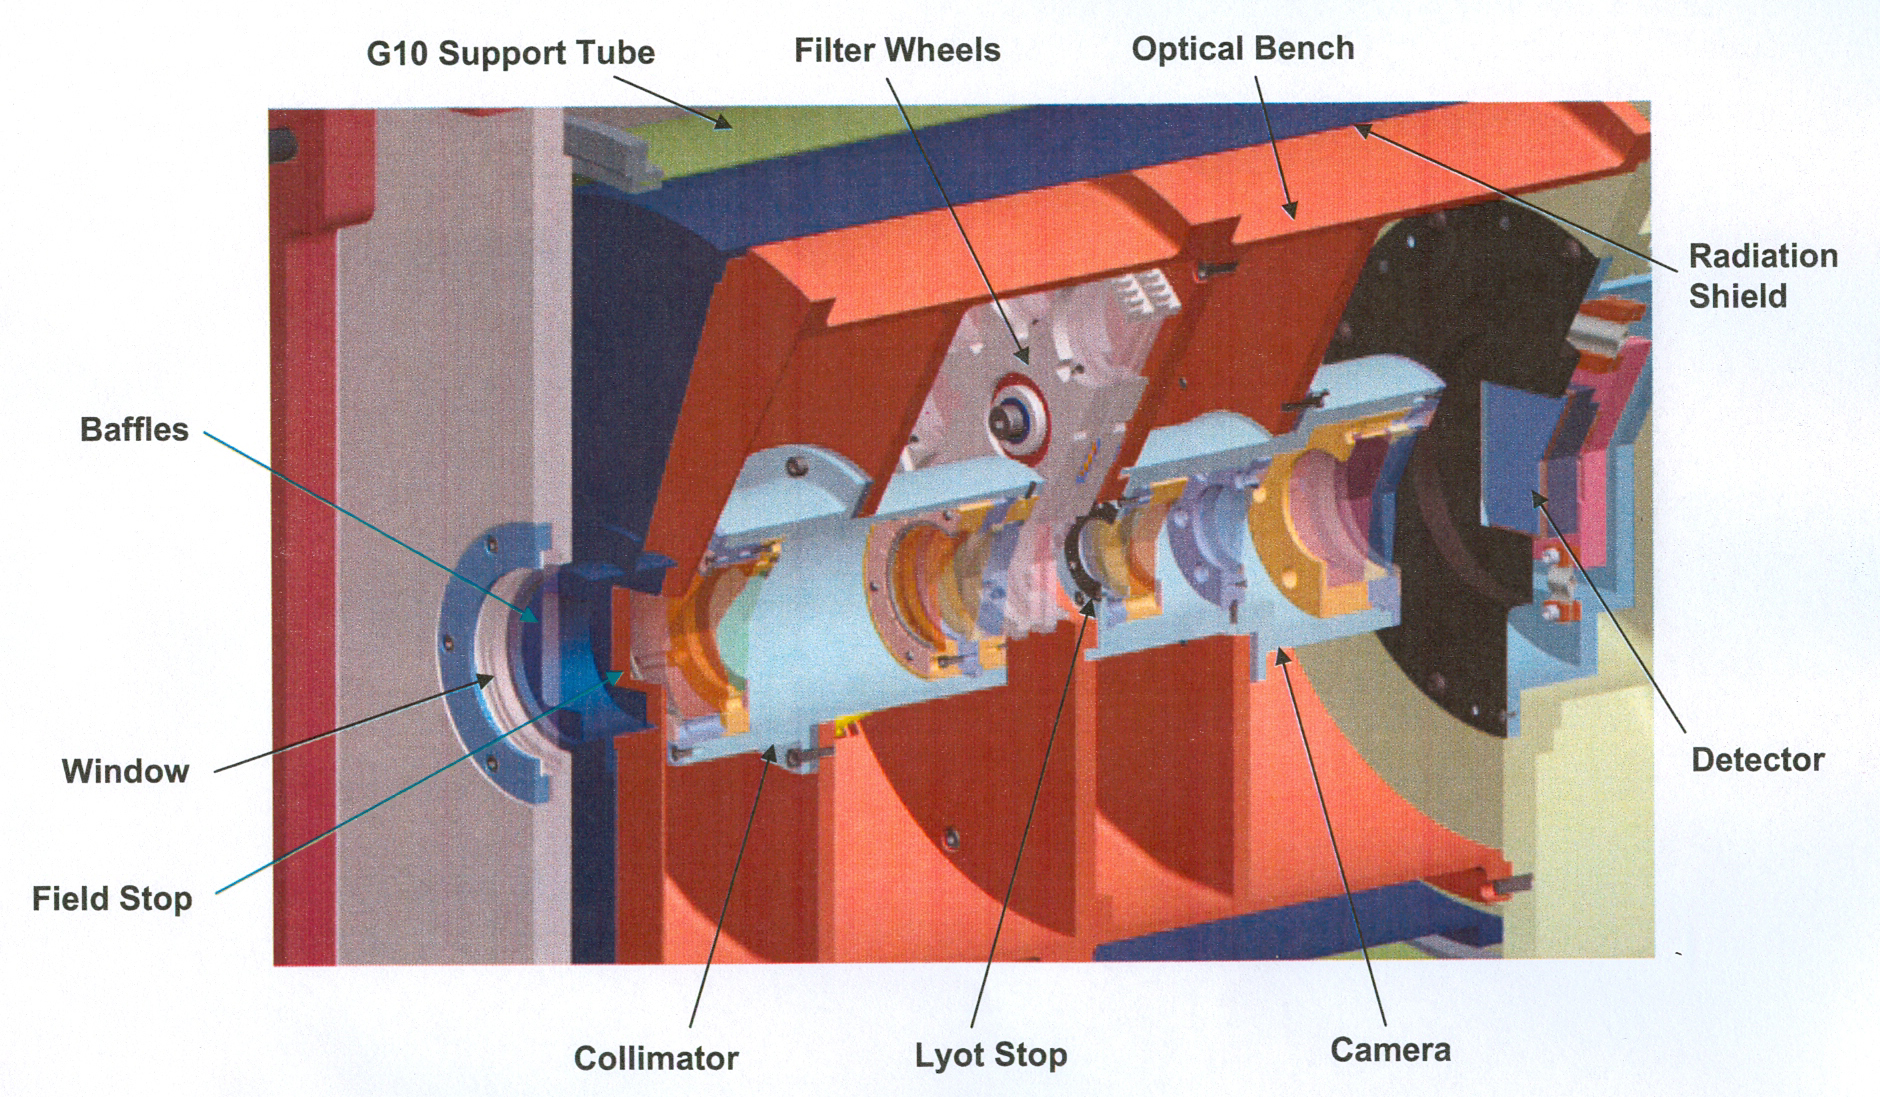
Figure 2: Close up of Figure 1, showing the optical elements in more detail.
Filters
The two 8-position filter wheels allow a total of 13 filters. Each filter wheel must have one open position and one wheel has an opaque blocker for taking dark frames. Table 2 lists the filter characteristics, as well as the observed signal in ADU/s corresponding to a mag=10.0 star determined from observations of the IR standards FS 30 and SAO 072320 at a bias of 0.7 v. The sky background levels in ADU/s-pixel have been measured during observing runs over the past several years spanning the temperature range -4 C to 26 C. The low and high ranges of the observed background are listed in the table. The background in the K band filters is dominated by thermal emission and varies a factor of four over this temperature range. In addition, the background in the other filters, except for the 1.06 and 1.082 μm narrowband filters, is dominated by OH airglow, which can vary a factor of two from the values listed in Table 3.1. Links to tracings of the individual filters are on the filters web page.
The three broadband filters are standard J, H, and Ks filters. The narrowband filters include those for He I (H II regions, PNe), Br γ and Pa β (ionized gas), [Fe II] (photodissociation regions and PNe), H2 S(1) (shocked molecular gas), CN and CO (cool stellar atmospheres). In addition, Br γ and [Fe II] filters redshifted by ~ 4500 km/s are used to provide continuum images for emission line imaging in those filters or for observing these emission lines in redshifted galaxies. Finally a filter near 1.06 μm is located in a region nearly devoid of telluric OH line emission for very low-background deep imaging or as a continuum filter for the He I filter.
NOTE: The redshifted Pa β and the original CO filter were replaced in January 2012 by a narrowband filter at 1.107 μm for investigation of the CN band and a redder, wider CO filter for detecting the CO band in late-type stars with better contrast. This filter is referred to as CO-w to distinguish it from the original narrow filter.
NOTE: The actual WHIRC filters were scanned by the vendor only at ambient temperature. Instead, standard size (25 mm) witness samples which were coated during the filter run were scanned at both ambient and cryogenic temperatures, and the difference between them was used to correct the ambient WHIRC filter parameters to their calculated cryogenic values. Because broadband filters often have oscillatory behavior in their transmission curves and narrowband filters of 1% fractional bandwidth rarely have a truly flat region at their peak transmission and may have broad wings, the definition of "average" transmission can be a matter of judgment. For the purpose of this table, we calculated the integrated transmission under the ambient filter curves and divided by the vendor-calculated cryogenic FWHM of the filter to derive the number listed as average transmission. Since the product of these is actually used in throughput calculations this is a somewhat artificial definition, but the FWHM is an important parameter, particularly for the study of high-redshift emission line targets.
The WTTM mirrors were recoated during the summer of 2013 to replace the deteriorating Ag coating with a proprietary Au coating. This has restored the signal levels to those which were measured at the time of the commissioning of WHIRC in 2008.
Table 2: WHIRC Filter Characteristics (September 2013)
| Filter | λ (μm) | Δλ (μm) | tavg | Signal 10.0 mag | Background | |
| J | 1.250 | 0.162 | 0.913 | 175000 | 5 | 6.7 |
| H | 1.651 | 0.310 | 0.867 | 195000 | 25 | 40 |
| Ks | 2.168 | 0.343 | 0.877 | 107000 | 70 | 270 |
| Low airglow | 1.060 | 0.0132 | 0.638 | 15900 | 0.18 | 0.22 |
| He I | 1.082 | 0.0094 | 0.706 | 10000 | 0.25 | 0.33 |
| CN | 1.107 | 0.0168 | 0.742 | 15600 | 0.3 | 0.38 |
| Pa β | 1.280 | 0.0158 | 0.872 | 15900 | 1.3 | 1.4 |
| [Fe II] | 1.646 | 0.0164 | 0.791 | 11100 | 1.9 | 2.6 |
| [Fe II] 45 | 1.668 | 0.0162 | 0.917 | 12300 | 2.5 | 4.1 |
| H2S(1) | 2.117 | 0.0216 | 0.680 | 6750 | 2.4 | 8.3 |
| Br γ | 2.162 | 0.0215 | 0.849 | 7300 | 3.8 | 13 |
| Br γ 45 | 2.188 | 0.0237 | 0.940 | 8000 | 5.0 | 18 |
| CO-w | 2.342 | 0.103 | 0.905 | 21700 | 13. | 220 |
History
Commissioning and characterization during 2008 were limited by three issues. The most annoying was the presence of electrical pickup which completely dominates the noise. This not only results in a read noise well above the requirement, but the spatial coherence leads to additional systematic errors in an aperture photometry measurement. The majority of the pickup noise was determined to come from the instrument rotator power supply. Relocating the WHIRC power supply near the instrument and shielding the cables helped reduce this. Replacement of the Monsoon IR Acquisition Board by another (supposedly identical) board has effectively eliminated the spurious pickup, and we are now seeing read noise levels which meet the requirements. While the noise could probably be reduced further with some effort, it is now sufficiently low to permit background-limited observing even in the narrowband filters. A second issue was intermittent operation of the filter wheel, which resulted in the January 2008 T&E run in excellent conditions being restricted to the J filter. This was traced to a cold solder joint in the filter wheel cable, which has now been repaired; no further problems have been seen in filter operation. The third issue was an unusual spatially dependent nonlinearity in the detector response which made it difficult to characterize the flatfielding and photometric quality possible with the instrument. We have found that lowering the detector bias from 1.0 v to 0.7 or 0.8 v results in a much more "normal" linearity performance which appears to be the same within 1 - 2 % over the array. We have since chosen 0.7 v as the standard operating bias, and the data presented in Table 2 were obtained with that value.
During the January 2008 T&E run in the J filter, images as good as 0.29 arcsec FWHM were obtained without WTTM correction on a night of excellent seeing. Optical testing using a pinhole array at the input of WTTM yields images with FWHM ~ 0.17 arcsec. This gives some confidence that WTTM/WHIRC is not likely to limit the image quality and that images in the 0.2 - 0.25 arcsec FWHM in the K band are a realistic goal with WTTM under good native seeing conditions. H band images as good as 0.26 arcsec FWHM have been observed with active WTTM correction. The signal levels shown in Table 2 were obtained with 0.5 arcsec FWHM images and utilized a 2 arcsec diameter extraction aperture.
3. Operation
The WHIRC detector operation uses the correlated double sampling (CDS) technique employed with virtually all infrared arrays. This involves a reset (biasing) of the detector, followed by a non-destructive readout of the array and a second readout starting after a predetermined time interval (which is the integration time). These two readouts are then subtracted to yield a bias-subtracted image. The minimum integration time is therefore the detector readout time, which is approximately 4 s for WHIRC. This mode, also referred to as "Fowler 1" is identified as "Fowler-1" on the MOP interface (all readout modes utilize the rolling reset with four digital averages, so these are not explicitly noted on the MOP). A second user mode, "Fowler-4" reads the array out four times at the beginning and four times at the end of the integration. This effectively reduces the read noise by almost a factor of two and is therefore a preferred mode for low-background, faint target observations, where one would be read noise limited. For such programs, one would want to use long frame times, so the longer detector readout time (16 s) does not represent a significant duty cycle penalty. NOTE: Multiple-readout data are not renormalized, so values in Fowler-4 mode will be four times those given in Table 1.
Progress in integrating the operation of WHIRC with the telescope was limited in part because of the concentration on the noise and detector issues noted above, but we have now established procedures for operating WHIRC using both the IAS guider and WTTM. A number of "canned" scripts to carry out dithered offsets have been written for the Monsoon Observing Platform (MOP), which is the standard user interface. In addition, one can utilize the WHIRC Observation Manager and Planner (WHOMP) to set up specific dither/offset scripts for particular targets in advance and execute them at the telescope. WHOMP scripts may also be edited at the telescope to provide some flexibility without the need to generate new scripts. For both WTTM and IAS guiding, it is necessary for the observer to ensure that the telescope motions during the script execution do not carry the selected guide star out of the range of the guide probe. This is particularly critical for operation with WTTM, since the available guide star field is limited to the WTTM field of view, approximately 4 arcmin (Fig. 3). We strongly suggest that observers determine the availability of a suitable guide star (R < 14.5 - 15.5) in their science fields prior to their observing run. One goal for a "next generation" upgrade to the WHOMP is to include guide star selection so that observers can ensure that the guide star will remain in range of the probe motion.
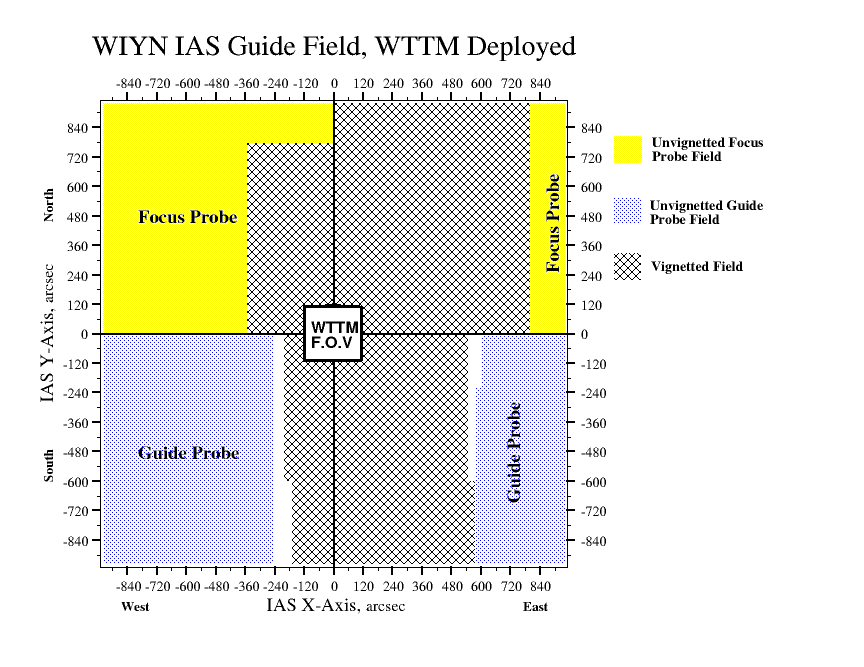
Figure 3: Schematic fields of view for the IAS guide probe (blue) and WTTM error sensor/guide probe (white square).
WHOMP
As noted above, the WHOMP may be started up at the telescope and used to design custom scripts for dithering, mapping, and sky offsetting. Sections 5.7 and 5.8 of the WHIRC User Guide describe how to set up and modify WHOMP scripts.
One useful feature of the WHOMP tool is the ability to project the WHIRC field of view in a dither/map sequence onto a Digital Sky Survey image of the field in the ds9 display. Because this is useful for advance planning of scripts, a downloadable version of the WHOMP application is linked to the WHIRC Home Page as a gzipped tarfile. After downloading the file, unpack and run the WHOMP as follows (note: one will also need the ds9 FITS viewer loaded):
- Unpack the file with the commands "gunzip whomp.tar.gz" and "tar xvf whomp.tar"
- Run the application with the command "wish whomp.tk". This will bring up the WHOMP GUI on the screen.
- Set up the map/dither script using the slider bars on the WHOMP GUI.
- Enter the coordinates of the field in the RA and DEC boxes; if a noncardinal rotator offset is used, enter this in the ROLL field. NOTE: The ROLL angle appears to generate rotation in degrees west of north, opposite to the astronomical convention.
- From the WHOMP "View" pulldown menu, select "Map and Target Dither in ds9". This will bring up a menu which will permit you to change the central coordinates or field dimensions if desired. The ds9 will display the DSS field with the dither and map fields superposed.
4. Performance
The reduction of the read noise as of September 2008 to typical values ~ 30 e in Fowler-1 mode and ~ 17 e in Fowler-4 mode should make it possible to achieve background-limited performance in all filters except perhaps the Low Airglow and HeI. The small pixel size results in a background signal, even in the broadband filters, which is about ten times smaller than that which users of typical wide-field imagers may be accustomed to. The combination of these factors means that relatively long integration times will be required to achieve background-limited performance, and narrowband imaging will be operationally similar to optical CCD imaging, utilizing a relatively small number of long (600s or more) exposures.
Sensitivity
One may roughly estimate the performance using the signal and background values listed in Table 1, under the assumption that the only sources of noise are the read noise of the detector and photon statistics (shot noise) from the signal and background. For an integration time "t" and a gain (e/ADU) of "g", the signal from a source of magnitude "m" is:
S = 10-0.4 (m -10) * Ns * t * g (e), where Ns is the signal from Table 1.
The noise is given by:
N = [ S + Nb * t * g * Npix + rn2 * Npix ] 0.5where Nb is the background level from Table 1 and Npix = 78.5 * A2 is the number of pixels within the extraction aperture of diameter A arcsec.
To do sky subtraction, at least two images of a field are required, and the subtraction of two images will effectively increase the noise by 1.414, which is the same as the signal gain from the increased target time resulting from two observations. For very faint targets, one will take multiple dithered images and generate a master sky frame which can be subtracted from each raw image. For a large number of frames, the increase in noise resulting from the sky subtraction can be quite small, and one can approach the theoretical signal-to-noise given by the ratio of S to N above. For multiple frames of a target, the S/N should increase as nf0.5, where nf is the number of frames (total integration time = t * nf).
Table 3 gives examples of this calculation for the J, H, and Ks filters, where the performance is given as the source brightness corresponding to a 10σ detection in a total of 1 hour of on-source time. We assume the use of the Fowler-4 observing mode, for which the read noise is assumed to be 20 e, and an extraction aperture 1.6 arcsec diameter, which is reasonable for an image FWHM = 0.5 arcsec. WTTM correction of the image in the future should yield further improvements in point-source limits, as would the use of psf-fitting photometry. The use of the Fowler-4 mode will increase the signal and noise values in ADU by a factor of four.
Note that the backgrounds in the J and H filters are close to the "typical" Kitt Peak values determined with other near-IR imaging instruments. The background in the Ks filter is higher for two reasons: WIYN is not an IR-optimized telescope and the emission from the central obscuration is not blocked by the internal cold stop; the optical path contains far more (9 vs 2) warm elements than seen by an imager mounted at a Cassegrain focus. The temperature was actually quite cold (-4 C) on the night the performance was evaluated, and on summer nights, the K band background can be a factor of four higher (Table 1), degrading the performance by a factor of two (0.7 mag). The anticipated goal is with WTTM, the smaller detection aperture will compensate for the higher background surface brightness.
Table 3: WHIRC Imaging Signal and Background Levels (ADU-s-1) and Estimated Performance
Nread = 20 e; aperture = 1.6 arcsec diamete
| Filter |
Signal (10 mag) |
Background (pixel) |
Background (mag-arcsec-2) |
Performance (10 σ 1 hr) |
| J | 1.83 × 10⁵ | 5.0 | 16.4 | 22.0 |
| H | 1.95 × 10⁵ | 25.0 | 14.7 | 21.3 |
| Ks | 1.09 × 10⁵ | 70.0 | 12.9 | 20.1 |
These performance estimates are quite good, but possibly optimistic. The calculation assumes the signal from the source to be negligible in comparison to the sky background, which is reasonable for a limiting calculation. However, reduction steps such as sky subtraction and flat fielding will invariably add some noise, as will any cosmetic defects or variations in sky background over the observation. During the July 2008 run, a series of twelve 300s integrations in J were obtained under (probably) photometric conditions and reduced using a local sky frame and dome flats to yield a 10 σ limit of 21.4, close to that calculated for Table 2 (the measured sky background in July was actually closer to 8 ADU/pixel, which would reduce the predicted limit in Table 2 to J = 21.8).
Linearity
All infrared arrays utilizing a unit cell architecture are inherently nonlinear, since the potential well created by the application of the bias voltage has a capacitance which increases as the collected charge fills up the well (one may think of the two capacitor plates moving closer together). In parallel with the capacitance of the rest of the unit cell, this yields a gain which varies slowly as the well fills up. Under the condition of constant signal flux, the plot of signal vs. time would begin at a slope near unity and slowly roll off until the array saturates. Alternatively, one can define a ":linearity" function, which is essentially the slope of the signal vs. time plot normalized to the value at small signal levels. A plot of the WHIRC linearity for a bias of 0.7 v is shown in Fig. 4a. Note that the linearity decreases smoothly by about 3% at a signal level of 36000 ADU, then much more quickly as the array saturates. One can obtain a linearity correction function by plotting the well-behaved data (below 36000 ADU) and fitting a second-order polynomial to it (Fig. 4a).
|
|
|

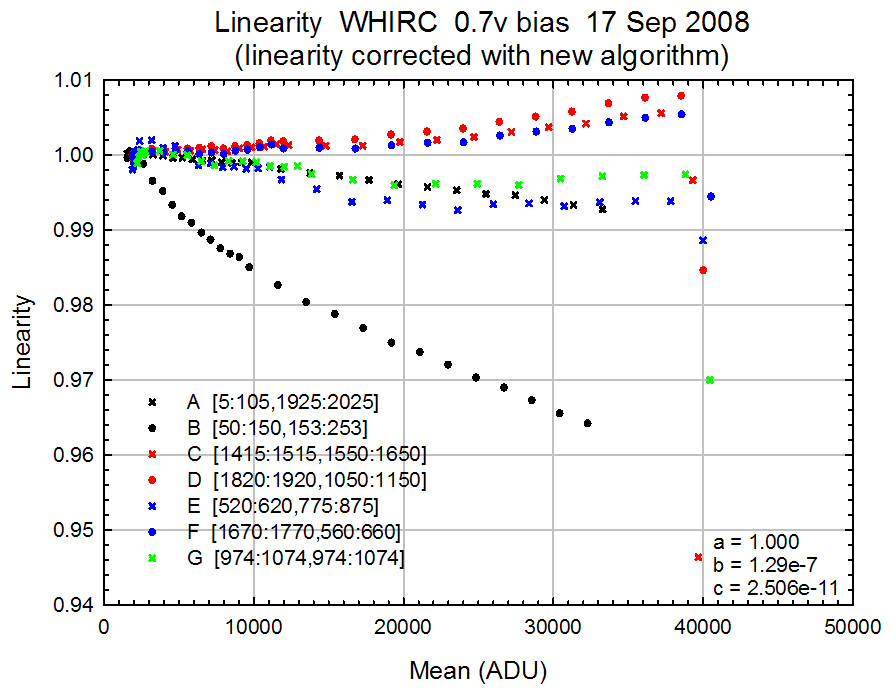
Figure 4: (left panel): Plot of linearity vs. signal level for a bias value of 0.7 v for seven subregions on the array. Note that the linearity behavior in a region near the lower left corner is different than that over the rest of the array. A second-order polynomial was fit to the well behaved data [excluding region B and the saturated data above 36000 ADU]. (right panel): The original data corrected for nonlinearity using the IRAF task irlincor and the coefficients derived from the second-order polynomial fit. Note that one can achieve correction to ~ 0.5% up to 38000 ADU.
The quadratic fit to the data in Fig. 4a is of the form y = A + Bx + Cx2, where
A = 1.000
B = -3.62 × 10⁻⁷
C = -1.839 × 10⁻¹¹
By inverting this function, one can derive a linearity correction function so that the corrected signal S' is related to the raw signal S by
S ' = S * (A + B*S + C*S2), where
A = 1.000
B = 1.29 × 10⁻⁷
C = 2.506 × 10⁻¹¹
The IRAF task irlincor is specifically designed to carry out this correction. It is critical that linearity correction be performed on the raw data, prior to any sky or dark subtraction. The corresponding irlincor coefficients are:
A = 1.000
B = 0.004227
C = 0.02691
Saturation
Because of the small pixel scale of WHIRC, it is tempting to think that saturation on brighter stars is not as critical as for a wide-field imager with larger pixels, but the combination of a 3.5-m aperture, a 4 s minimum integration time, and good image quality does mean that one must consider this issue. If WHIRC attains its goal performance in conjunction with WTTM, it will yield image cores with FWHM < 3 pixels, similar to what one obtains with FLAMINGOS on the 4-m under median seeing conditions.
The data presented in Table 2 were obtained under seeing conditions ~ 0.5 arcsec (5 pixels FWHM). Empirically, the peak pixel flux was typically 0.03 of the integrated flux within the 1.6 arcsec diameter aperture. For a H = 10.0 star in the minimum integration time of 4 s, this yields a peak pixel signal of ~ 23000 ADU, seemingly at a safe level of slightly over half full well. However, seeing fluctuations over these short times could result in "good" images which push the peak pixel close to saturation.
Finally, note that we have settled on a bias value of 0.7 v for operation, since the lower bias appears to give fewer "maverick" pixels. However, the saturation level is ~ 36000 ADU.
Flatfielding
The initial WHIRC tests, carried out at a detector bias of 1.0 v, gave very strange linearity behavior, which resulted in poor flatfielding. The current bias of 0.7 v gives predictable linearity, as demonstrated above, and stable flatfielding performance. Long-term stability of flats in a given filter is generally better than 1%, although somewhat degraded in the "palmprint" area of the array. Scans of a standard star over the field suggest that photometry to at least 2% is possible, once the pupil ghost (see below) has been corrected.
Table 4 lists recommended lamp settings for dome flats through the WHIRC filters, for an integration time of 5 s in Fowler-1 mode and 16 s in Fowler-4 mode. In general, one should keep the integration time for dome flats as short as possible, to minimize any dark current or thermal background. We have picked a target signal level of 10000 ADU in Fowler-1 mode (or the equivalent 40000 ADU in Fowler-4 mode) to arrive at these values.
NOTE: These levels were measured in September 2013 after the recoating of the WTTM mirrors.
Table 4: Recommended Flatfield Lamp Settings -- HIGH Lamps
| Filter | Fowler-1 | Fowler-4 | ||
| Lamp Setting | Signal | Lamp Setting | Signal | |
| J | 600 | 11000 | 470 | 44300 |
| H | 425 | 11000 | 340 | 41800 |
| Ks | 380 | 10000 | 215 | 44500 |
| Low airglow | 1650 | 11000 | 1120 | 44500 |
| He I | 1900 | 10600 | 1240 | 44600 |
| CN | 1450 | 11000 | 1000 | 44600 |
| Pa β | 1200 | 10500 | 820 | 44500 |
| Fe II | 1000 | 10000 | 680 | 44500 |
| Fe II (4500) | 1050 | 11000 | 660 | 44000 |
| H2 S(1) | 1050 | 11000 | 640 | 44500 |
| Br γ | 950 | 10500 | 600 | 44500 |
| Br γ (4500) | 900 | 11000 | 570 | 44500 |
| CO-w | 450 | 10000 | 300 | 44500 |
Pupil Ghosting
Like many in-line refractive imaging instruments, WHIRC displays a pupil ghost, which is seen in both sky and domeflat images. This feature is due in part to reflections from the detector and the optical surfaces. The effect can be seen at all wavelengths (Fig. 5), although it is exacerbated at thermal wavelengths (K band) in the case of WHIRC. The pupil ghost manifests as a broad peak centered on the array, with a peak value about 5% above average at J, but almost 25% at Ks. This does NOT represent a real peak in the response, so the use of a flatfield constructed from raw sky or lamp flats will give artificially low flux values for targets near the center of the array.
|
|
|
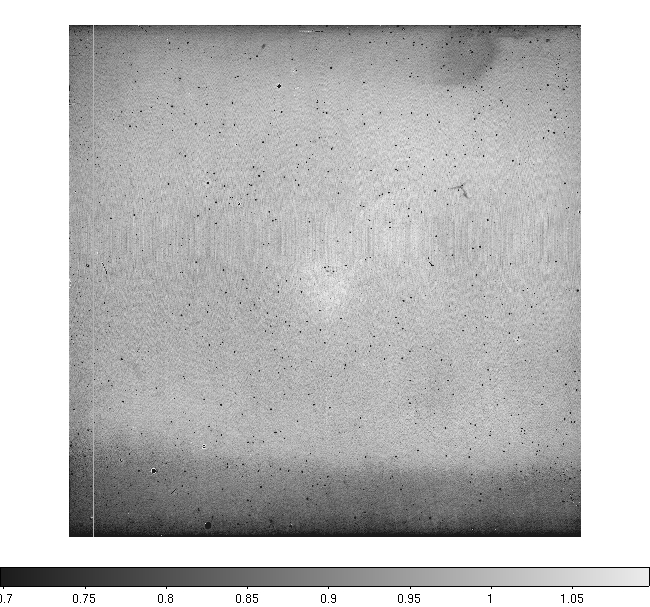

Figure 5: Flatfields through the J (left panel) and Ks (right panel) filters at a bias of 0.7 v. These were taken using the dome screen and the "lights on - lights off" subtraction technique, and normalized to 1.0. The decreased response at the top and bottom of the arrays probably represents variations in the detector quantum efficiency or antireflection coating characteristics, but appears to calibrate out. The pupil ghost, visible as a bright spot in the center of the array, is not a true peak in the response, and must be calibrated out of the flats.
The pupil ghost in the Ks flat should have the same spatial geometry as that in the J band, since both were generated by the "lamp on - lamp off" technique which subtracts out common background structure. Since the ghost in the Ks band is significantly stronger, the ratio of the two should, to first order, be a template for the pupil ghost alone. Using the central 800 × 800 pixel region, smoothed to 21 pixels, as the pupil ghost template, the IRAF task mscred.rmpupil appears to do a credible job of removing this artifact (Fig. 6), for flats in all of the filters.
The pupil removal technique was evaluated by observing a moderately bright (Ks ~ 11) star at 100 points in and around the region of the pupil ghost under apparently photometric conditions, and measuring the signal for images flattened both without and with correction for the pupil ghost. The results (Fig. 7) show that the technique appears to eliminate the effects of the pupil ghost to within the measurement tolerances. This experiment is described in more detail in Appendix A of the Data Reduction Manual.
|
|
|
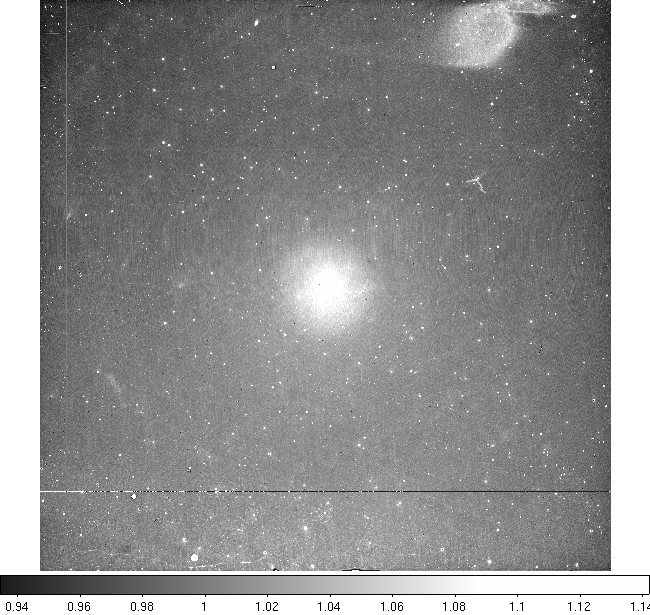
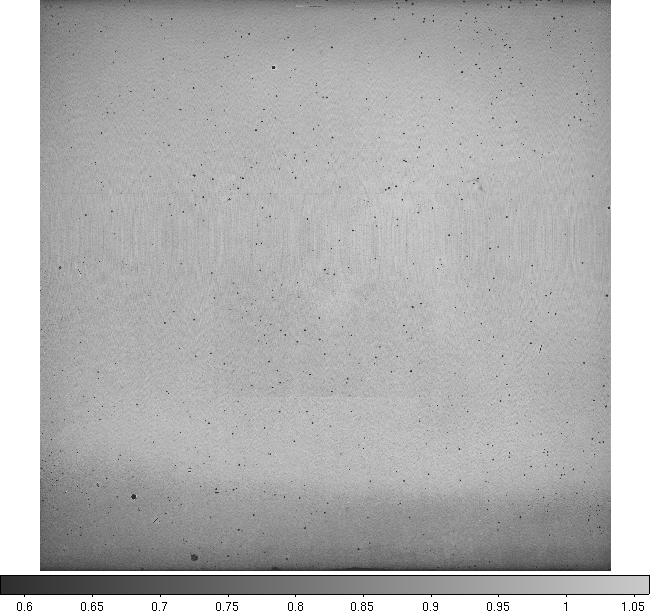
Figure 6: The ratio of a processed flat in Ks to that in J (left panel). Except for the "fingerprint" artifact in the J flat, the ratio should represent structure only from the pupil ghost. The central region, smoothed to 21 pixels, was used as a template for removal of the pupil ghost, resulting in a corrected Ks flat (right panel).

Figure 7: Photometry of a star (Ks ~ 11) measured at 100 points centered on the pupil ghost coordinates. Plots are for sky-subtracted data (top panel); data flattened but with no correction for the pupil ghost (middle panel); data flattened with correction for the pupil ghost (bottom panel). The abcissa is the radial distance from the pupil ghost center at [1032:1002] The large effect of the pupil ghost at Ks (almost 0.15 mag) appears to be eliminated to within the measurement tolerance.
Dimples
A typical flatfield image (Figure 5) shows numerous circular features which appear to be array defects. The cause of these features is unknown, but they have been seen in other Virgo arrays for the VISTA project. However, it is important to realize that these are not dead pixels, but regions of depressed sensitivity which still respond linearly to radiation; as a result, they can be largely corrected by flatfielding (Figure 8). The system sensitivity within these regions is, of course, reduced.
The measured flux from a star which falls on one of these regions will be significantly reduced in unflattened images, but relatively unaffected in the flattened images. In the analysis results presented below in Table 5, this factor is probably the greatest contribution to the higher sigma in the unflattened images and explains why only some stars were affected.
 |
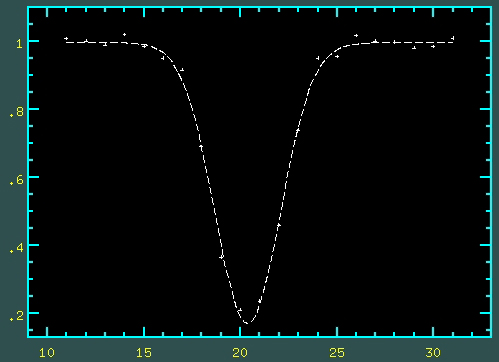  |
Figure 8: (top left): 128 × 128 subimage of an H-band dome flat, showing the normal "tree-ring" structure and the circular, apparently dead features. A line plot through one of the spots (lower left) shows that the features are not dead pixels, but regions of reduced response. The ratio of two separate flatfields taken five months apart (top right) shows that the features are quite stable over long periods to within a few percent (lower right).
Flatfield Stability
Although we have limited data taken under photometric conditions to establish the photometric accuracy which one can expect, flatfields taken over the time span beginning April 2008 (once we had settled on a bias voltage of 0.7 v) have proved to be remarkably stable. All of these dome flats were taken using the same "lights on - lights off" procedure and normalized in the same way to the signal level in two subregions well away from the pupil ghost. Figure 9 shows ratios of flatfields taken in September 2008 to those taken in April 2010 for the Ks broadband and Paβ narrowband filters. Even in the vicinity of the pupil ghost in the Ks flat, the deviations are no more than 1 %.
 |
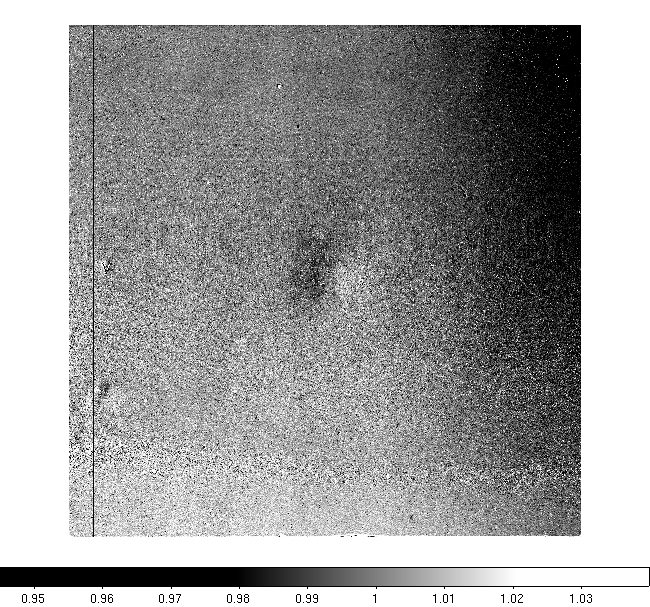 |
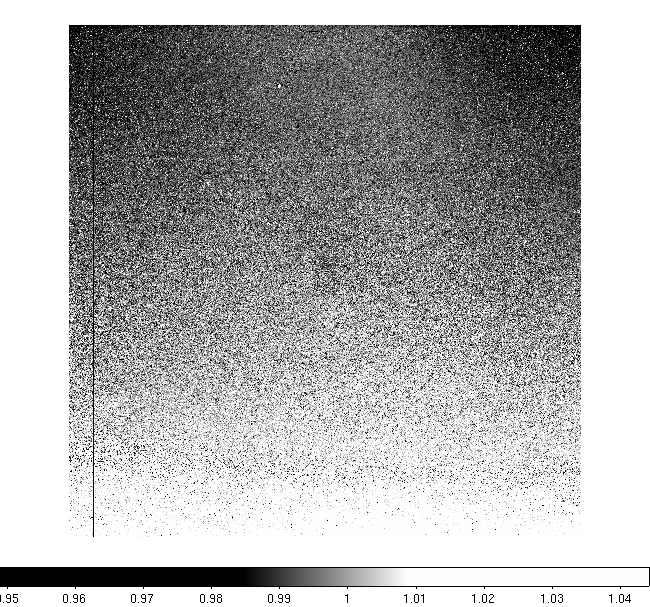
Figure 9: Ratios of dome flats taken in September 2008 to those taken in April 2010 for the Paβ narrowband filter (left panel) and the Ks filter (right panel). The spatial stability of the flats is generally better than 1% over this time span, even near the Ks pupil ghost.
Dome or Sky Flats
We recommend the use of dome flats generated by the "lights on - lights off" technique. This effectively subtracts out any pupil artifacts common to both, such as thermal radiation from the telescope or warm WTTM optics. As noted above, we have monitored the spatial stability of dome flats and found them to be consistent within 1% over almost the entire field. We have limited experience with analyzing sky flats, which will exhibit a pupil ghost which is a combination of that from the sky and the telescope; these two contributions not only have different spatial characteristics, but will vary in relative strength with ambient temperature. One is likely to find that one obtains sufficient flux to generate a sky flat during observing only in the broadband H and Ks filters; sky flats in the other filters must be obtained during twilight. We recommend that observers obtaining sky flats also acquire dome flats as a backup.
Photometric Performance
We have carried out several experiments to evaluate the photometric performance possible with WHIRC. A complete report on these is available for downloading. One of these experiments, described briefly here, suggests that accuracy of 1 - 2% should be presently possible in regions of the array away from the pupil ghost.The pupil ghost correction algorithm referenced above will hopefully yield this precision over the entire field of view, but this has not yet been verified experimentally
In one experiment, the open cluster NGC 7790 was observed using a 3 × 3 grid on 30 arcsec centers through six filters (J, H, Ks, Paβ, FeII, and Brγ) to verify the photometric precision/flatfielding in both broad- and narrowband filters. This cluster (Figure 10) has six well-determined photometric standards from the list of Hunt et al. (1998, AJ, 115, 2594). The six stars are spread out over almost 2 arcmin, so the grid gave good coverage over the array. The observations were reduced in the standard fashion by first correcting for linearity, then generating a sky frame from the median of the observations and subtracting this from each of the raw frames to yield a sky-subtracted image. This was then divided by the dome flat for the appropriate filter, but with no correction for the pupil ghost. The stars were then measured using the IRAF task phot, with a 3 arcsec aperture with sky subtraction and the measured magnitudes were then subtracted from the published values.
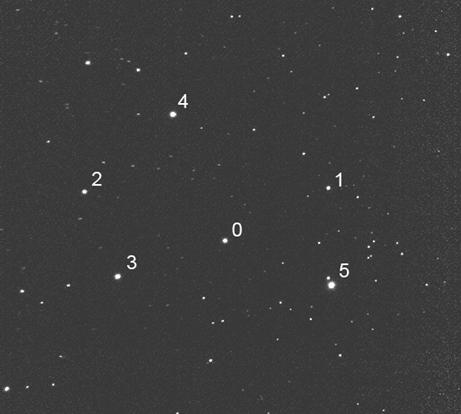
Figure 10: WHIRC J band image of the open cluster NGC 7790. The six stars from Hunt et al. are noted. The results from star 5 were rejected because the published magnitudes included the faint companion which is easily resolved in this image.
The residuals (measured - published) were then averaged over the nine sky positions and the standard deviation of the mean calculated, for each of the six stars in the six filters. This was done for the images both prior to and after flatfielding, to evaluate the effect of the procedure. Table 5 presents the averages of the results for the nine positions: the mean of the flatfielded images, and the standard deviation of the mean for the unflattened and flattened images. Note that this experiment require photometric conditions, but is not sensitive to the accuracy of the published standard star magnitudes. The last two columns represent the average (and standard deviation) over the six stars; this does bring into consideration the uncertainty of the published Hunt et al. magnitudes, which are formally in the 0.8 - 1.8 % range.
The apparent discrepancy in the results for star 5 compared to the others was resolved when it became clear that Hunt et al. had included the flux from a companion star about 3.2 mag fainter approximately 3.5 arcsec away; the two stars were of course easily resolved in the WHIRC images. The final column presents the results excluding star 5. Since the 3 × 3 grid would have placed a star within the pupil ghost for at most one of the nine positions, the practical effect of neglecting the ghost was small for this experiment. The results summarized in Table 5 suggest that photometric accuracy on the order of 1 - 2% should be possible away from the center of the field, where the pupil ghost is significant. We plan to re-evaluate these data using flatfields corrected for the pupil ghost.
Table 5: Results of Position-averaging Photometry in NGC 7790

Image Ghosts
As with any on-axis refractive optical system, light reflected from the detector and from the lens surfaces can result in ghost images. Tilting the filters in the wheel eliminated a cause of many potential ghost images, but there are a number of low-level ghost images which can be seen in the field of very bright, heavily saturated stars. We have carried out tests using an extremely bright (0.5 mag) star and a 5 s frame time, which resulted in an oversaturation of the peak pixels by a factor ~ 104. Off-axis images show two compact ghosts, the brighter of which is at a relative level of ~ 2 × 10⁻⁴ in the J band, the other approximately an order of magnitude fainter; the brighter of the two was predicted by analysis during the instrument design and established the requirement for ghost images. An additional feature not seen in the modeling is an apparent glint which occurs when the target is within a relatively narrow radial range (65 - 70 arcsec) from the center of the array (Fig. 11a). In spite of its impressive appearance, the brightest "speckles" in this artifact are well within the requirements at a relative level ~ 3 × 10⁻⁵ of the primary target.
 |
 |
Figure 11: Images of the star α Ser (K = 0.15) at locations 50W50S at Ks (left panel) and 75W75S at H (right panel) of the array center. The left panel shows the bright "glint" which appears for a narrow range of off-axis angles. The "C" ghosts refer to a series of annular and arc ghosts which appear at various locations, depending on the position of the primary star. The pointlike ghost "D" was predicted by analysis during the instrument design phase
A more complete series of images can be found in the WHIRC Ghost Report.
Fringing
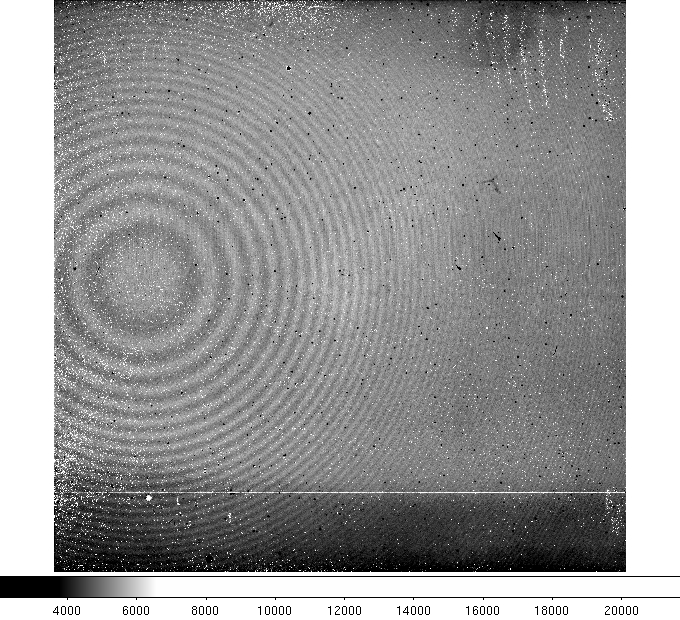
The sky in the Paβ, Paβ45, and broadband H filters can show dramatic Newton's Ring fringes (Fig. 12a). These almost certainly arise from the OH lines in the sky, since their spacing is proportional to the filter wavelength, but the mechanism within WHIRC which produces these is not known. The central fringe appears to be at the same array location in the three filters which have demonstrated this artifact. Sky images taken on different dates appear to show a slight phase difference in the fringe pattern, so it is unfortunately impossible to generate a master fringe template for removing the fringes; one must use the data from a given night to do so. Once a fringe template has been generated from the sky images, the IRAF task mscred.rmfringe does a reasonable job of removing the fringes (Fig. 12b); more information is given in the Data Reduction Manual.
 |
 |
Figure 12: (left panel) Raw 600 s sky image through the Pa β filter. (right panel) Multiple images were used to generate a fringe template for the sky fringes, which was then used to subtract out the pattern using the rmfringe task.
Because WTTM utilizes off-axis reflective optics, there is a small amount of field distortion at the input to WHIRC. The distortion is asymmetric (keystone) and is less than 1%. The difference in the plate scales in the x and y coordinates (0.09856 and 0.09872 arcsec/pixel) may or may not be significant. The additional distortion from WHIRC is very small and is negligibly dependent on wavelength. The links accesible from the WHIRC Home Page provide detailed plots, Zemax files, and text/database files for use with the IRAF routine geotran to remove the distortion prior to generating a spatial mosaic. Further information is given in the Data Reduction Manual. We have not yet investigated any effects of distortion correction on photometry.
5. Observing with WTTM
WHIRC was designed to mount on the WTTM port to take advantage of the excellent native seeing at WIYN combined with the tip/tilt correction from WTTM. We anticipate that the improved native seeing at longer wavelengths and the WTTM correction can result in images which approach diffraction-limited in the K band.
Prospective users of WTTM should keep several things in mind. Tip/tilt correction may represent the first step towards adaptive optics, but it is only the first step. WTTM will not miraculously produce excellent images when the seeing is poor. Experience at optical wavelengths and our limited experience with WHIRC suggest that one can expect improvement on the order of 0.1 - 0.15 arcsec in FWHM when the native seeing is in the 0.5 - 1.0 arcsec range. Greater improvement has been seen in instances where the image quality is dominated by wind buffeting (Fig. 13).
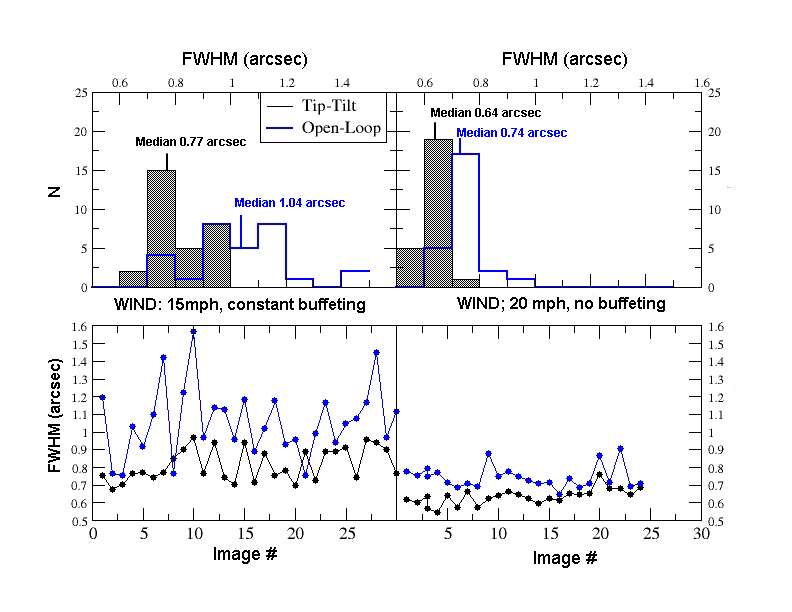
Figure 13: Results of two experiments to determine the relative improvement of FWHM with WTTM, using 10 s exposures in the H band. Courtesy C. Corson and H. Schweiker.
The second point is to consider that WTTM is essentially a fast guider, typically sampling at 100 - 150 Hz. Stars which may seem bright in a deep CCD image may be too faint for WTTM guiding. Under reasonably good seeing conditions (0.8 arcsec), one can guide with WTTM at 100 Hz on stars as faint as R = 15.5. However, momentary bad seeing, wind shake or focus drift can cause the error sensor to lose acquisition on the star, so we generally recommend using stars brighter than R = 14.5.
Also, users must consider the limited acquisition field for WTTM. Because the error sensor views the guide star through the WTTM optics, the field is limited to that of WTTM itself, approximately 4 arcmin (Fig. 3). The guide star acquisition process at the telescope involves taking an image of the science field and locating the guide star within that image; the [x,y] coordinates on the image are used as input to the WTTM guide probe. Therefore, the use of WTTM requires that the appropriately bright guide star be within the WHIRC field of view and that any scripted dithers be sufficiently small in amplitude to keep the WTTM guide probe within its limited range.
We strongly suggest that prospective users of WTTM locate potential guide stars for their fields prior to arriving at the telescope. This is particularly important in determining if there are no available guide stars, since one will know in advance that the IAS guider must be used for that field. More information on WTTM operation may be found in the User's Manual.
Jenny Power has designed a WTTM Guide Star Locator tool to locate WTTM guide stars for specified WHIRC field coordinates, providing both tabular and graphical results. One may also load a selected dither pattern into this tool to evaluate the motion of the guide star within the WHIRC field as the telescope is moved.
6. Observing with Other WIYN Instruments
The multi-instrument capability of the IAS port lends itself to the use of WHIRC in combination with the Bench Spectrograph fed by the Sparsepak IFU installed at the CCD port. Obvious applications include combined optical spectroscopy/IR imaging observations of science targets or nights split between optical and IR observers. This can be done in principle, requiring only moving the WTTM Pickoff Mirror in the IAS out of the beam and switching computer operation over from WHIRC to the spectrograph CCD (or vice versa). Alternatively, one may switch the tertiary mirror to feed the wide-field optical imager ODI in combination with WHIRC. There are some important considerations, however.
- Operation of the Bench Spectrograph CCD may introduce pickup noise on WHIRC. Thus, it is necessary to power down the optical imager completely prior to using WHIRC. We have not seen any evidence that the WHIRC electronics can introduce pickup on either the Bench Spectrograph or ODI.
- Both the observer and OA will need to make computer interface changes. There are also stability issues for both instruments after they have been powered up, so an instrument changeover during the night will involve some loss of observing time. If science and weather considerations permit, we suggest that a single observer planning to use both WHIRC and another instrument try to accomplish their program by successive, rather than split night, use of the imagers.
- Observer support is also a potential problem. The instrument scientists and the Operations Coordinator have therefore established the following policy:
Current policy requires anyone wishing to use both WHIRC and another WIYN instrument during a run to be fully proficient with at least one of the instruments and therefore require no instrument start-up support. In this sense, a proficient observer is one who has used the instrument at least once in the past year and has had a full start-up by qualified WIYN personnel within the past three years. Furthermore, observers are required to fully discuss their plans for each instrument use in the comment section of the ORPF and to contact the appropriate WIYN staff 6 weeks prior to their run to discuss the details of their observations. These discussions will include the potential risks in degraded performance and observing inefficiency, and it will be assumed that observers carrying out a dual-instrument program will understand and accept these risks.
richard.joyce@noirlab.edu
Updated 02 October 2013
Updated on January 28, 2025, 10:00 am