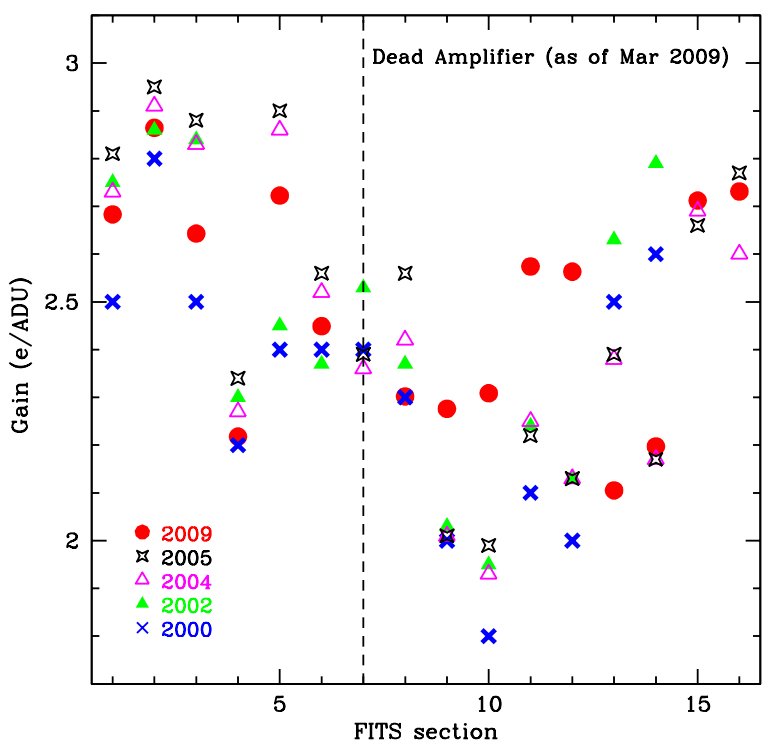
CCD test data for 16 channel mode
Report, 2002-05-17 (brief)
Full frame, unbinned, dual redout:
| CCD (1) | 1a | 1b | 2a | 2b | 3a | 3b | 4a | 4b |
| FITS section | 1 | 2 | 3 | 4 | 5 | 6 | 7 | 8 |
| Gain (e-/ADU) 09 Nov 2009 (2) |
2.7 | 2.8 | 2.7 | 2.3 | 2.8 | 2.5 | N/A | 2.3 |
| Read noise (e-) 09 Nov 2009 (3) |
6.7 | 12.8 | 7.0 | 5.2 | 8.4 | 7.2 | N/A | 5.6 |
| Non- linearities 17 May 2002 (4) |
~<1% | ~<1% | ~<1% | ~<1% | ~<1% | ~<1% | ~<0.8% | ~<1% |
| Non- linearities Oct 2005 (4) |
~<1% | ~<1% | ~<1% | ~<1% | ~<1% | ~<1% | ~<1% | ~<1% |
| Spurious charge (ADU) 17 May 2002 (5) |
N/M | ~10 | ~5 | ~8 | ~10 | ~12 | ~15 | ~8 |
| Full well (e-) 08 May 2004 (6) |
130,000 | 125,000 | 91,000 | 87,000 | 77,000 | 81,000 | 70,000 | 71,000 |
| Full well (e-) Oct 2005 (7) |
>112,000 | >118,000 | 86,000 | 89,000 | 87,000 | 97,000 | 67,000 | 67,000 |
| CCD (1) | 5b | 5a | 6b | 6a | 7b | 7a | 8b | 8a |
| FITS section | 9 | 10 | 11 | 12 | 13 | 14 | 15 | 16 |
| Gain (e-/ADU) 09 Nov 2009 (2) |
2.3 | 2.3 | 2.6 | 2.6 | 2.1 | 2.2 | 2.7 | 2.7 |
| Read noise (e-) 09 Nov 2009 (3) |
6.4 | 6.2 | 15.2 | 7.3 | 7.9 | 12.0 | 10.4 | 8.7 |
| Non- linearities 17 May 2002 (4) |
~<1% | ~<1% | ~<1% | ~<1% | ~<1% | ~<1% | ~<1% | ~<1% |
| Non- linearities Oct 2005 (4) |
~<1% | ~<1% | ~<1% | ~<1% | ~<1% | ~<1% | ~<1% | ~<1% |
| Spurious charge (ADU) 17 May 2002 (5) |
~-5 | ~-5 | ~-5 | ~-5 | ~-2 | ~-2 | ~-5 | ~-5 |
| Full well (e-) 08 May 2004 (6) |
76,300 | 84,000 | 97,000 | 102,000 | 95,500 | 93,000 | 62,000 | 67,600 |
| Full well (e-) Oct 2005 (7) |
76,000 | 80,000 | 73,000 | 81,000 | 91,500 | 100,000 | 56,000 | 61,000 |
Notes:
1. When looking at a Mosaic image, the 8 lower segments are denoted from left to right (ccd,amp) 1a,1b,2a,2b,3a,3b,4a,4b. Across the top, from left to right: 5b,5a,6b,6a,7b,7a,8b,8a (see plot below).
2. Gain measured from Transfer curve.
3. Read noise calculated from standard deviation of a bias frame × gain.
4. Nonlinearities are the width of the envelope of the count rate curve over a large part of the dynamic range of the detector. They include any variation in the light source and shutter effects, although the shutter delay has been removed to first order. These measurements are therefore an upper bound.
5. Spurious charge is charge that is injected into the CCD as a result of parallel clocking. It shows up as a slope in the bias level in the vertical direction, quoted here in ADUs from the top to the bottom of the unbinned image.
6. Measured in the La Serena lab after the installation of a new CCD #3. Full well was determined from the variance curve, noise from the overscan.
7. Measured in situ at Blanco prime focus, using flat field lights.
Updated on June 4, 2021, 9:37 am


