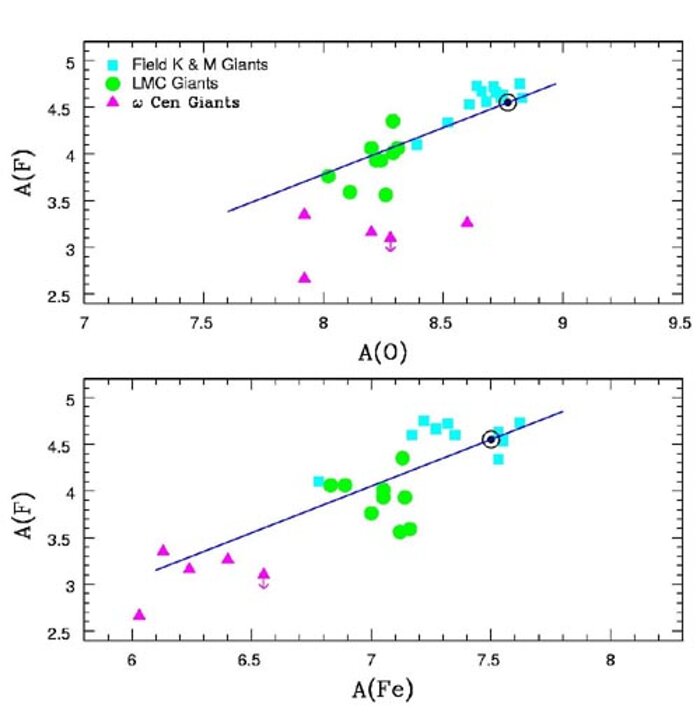
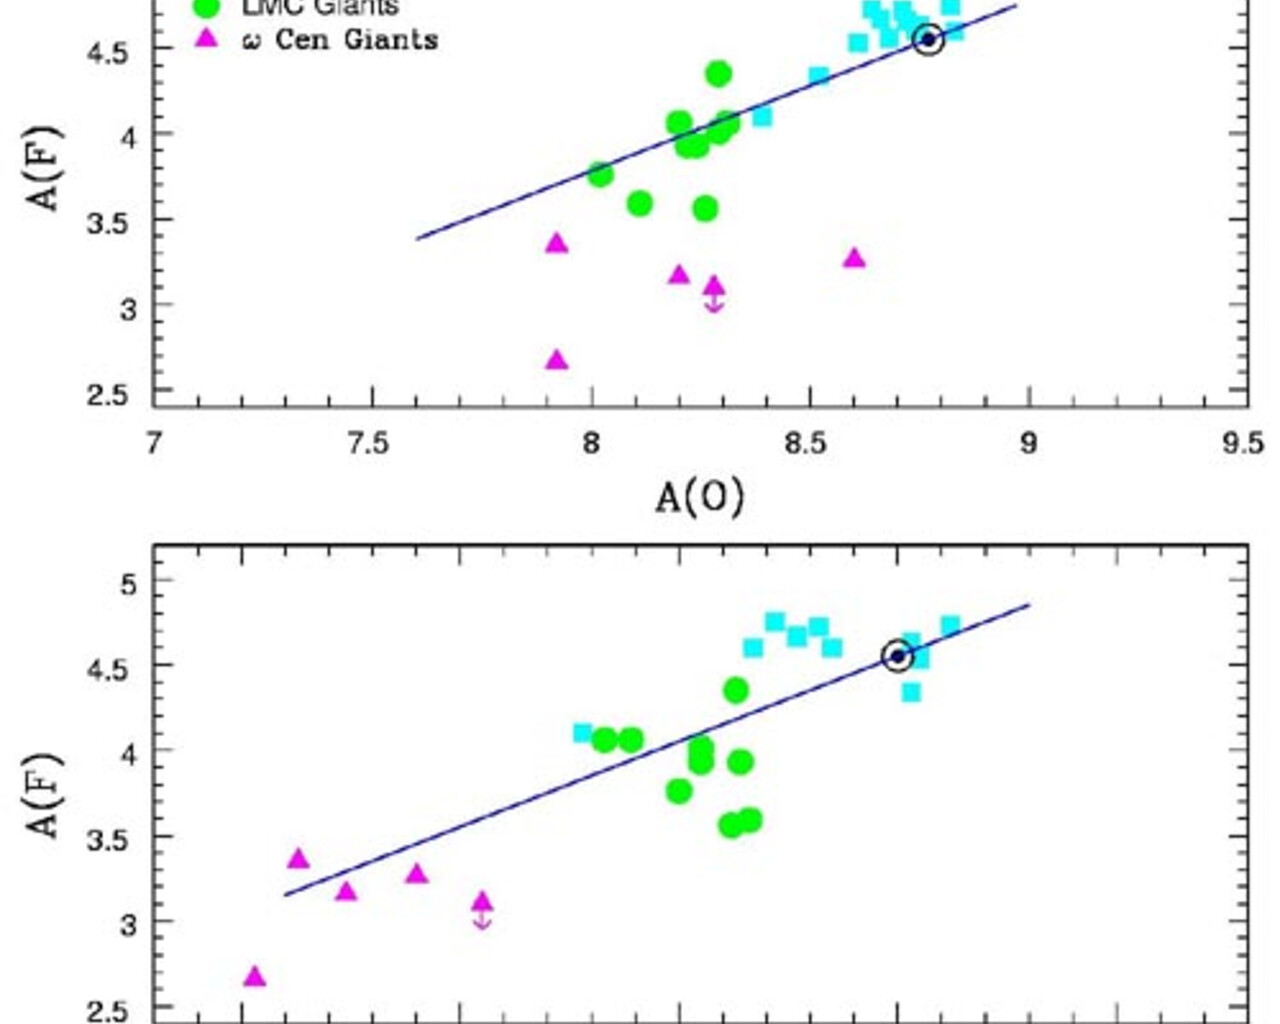
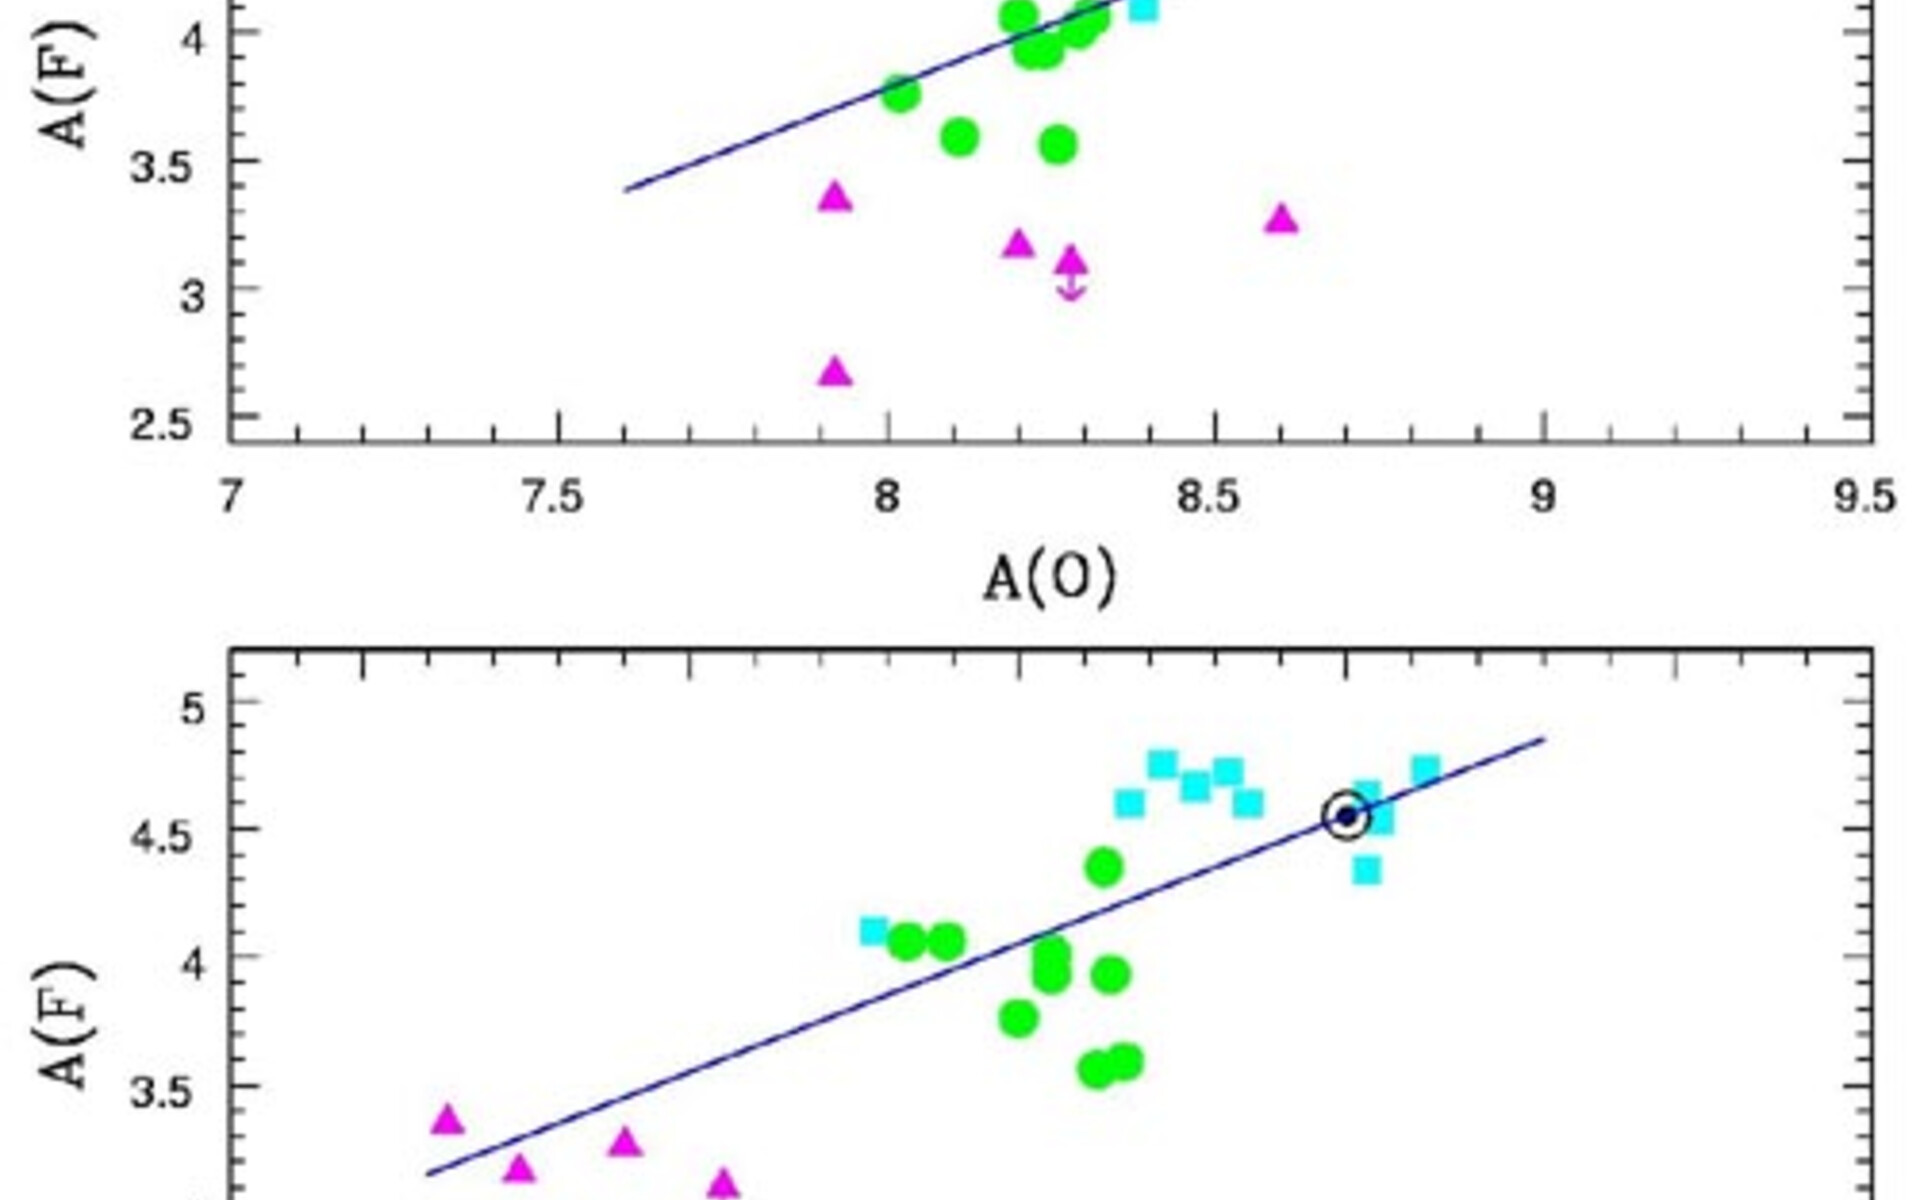
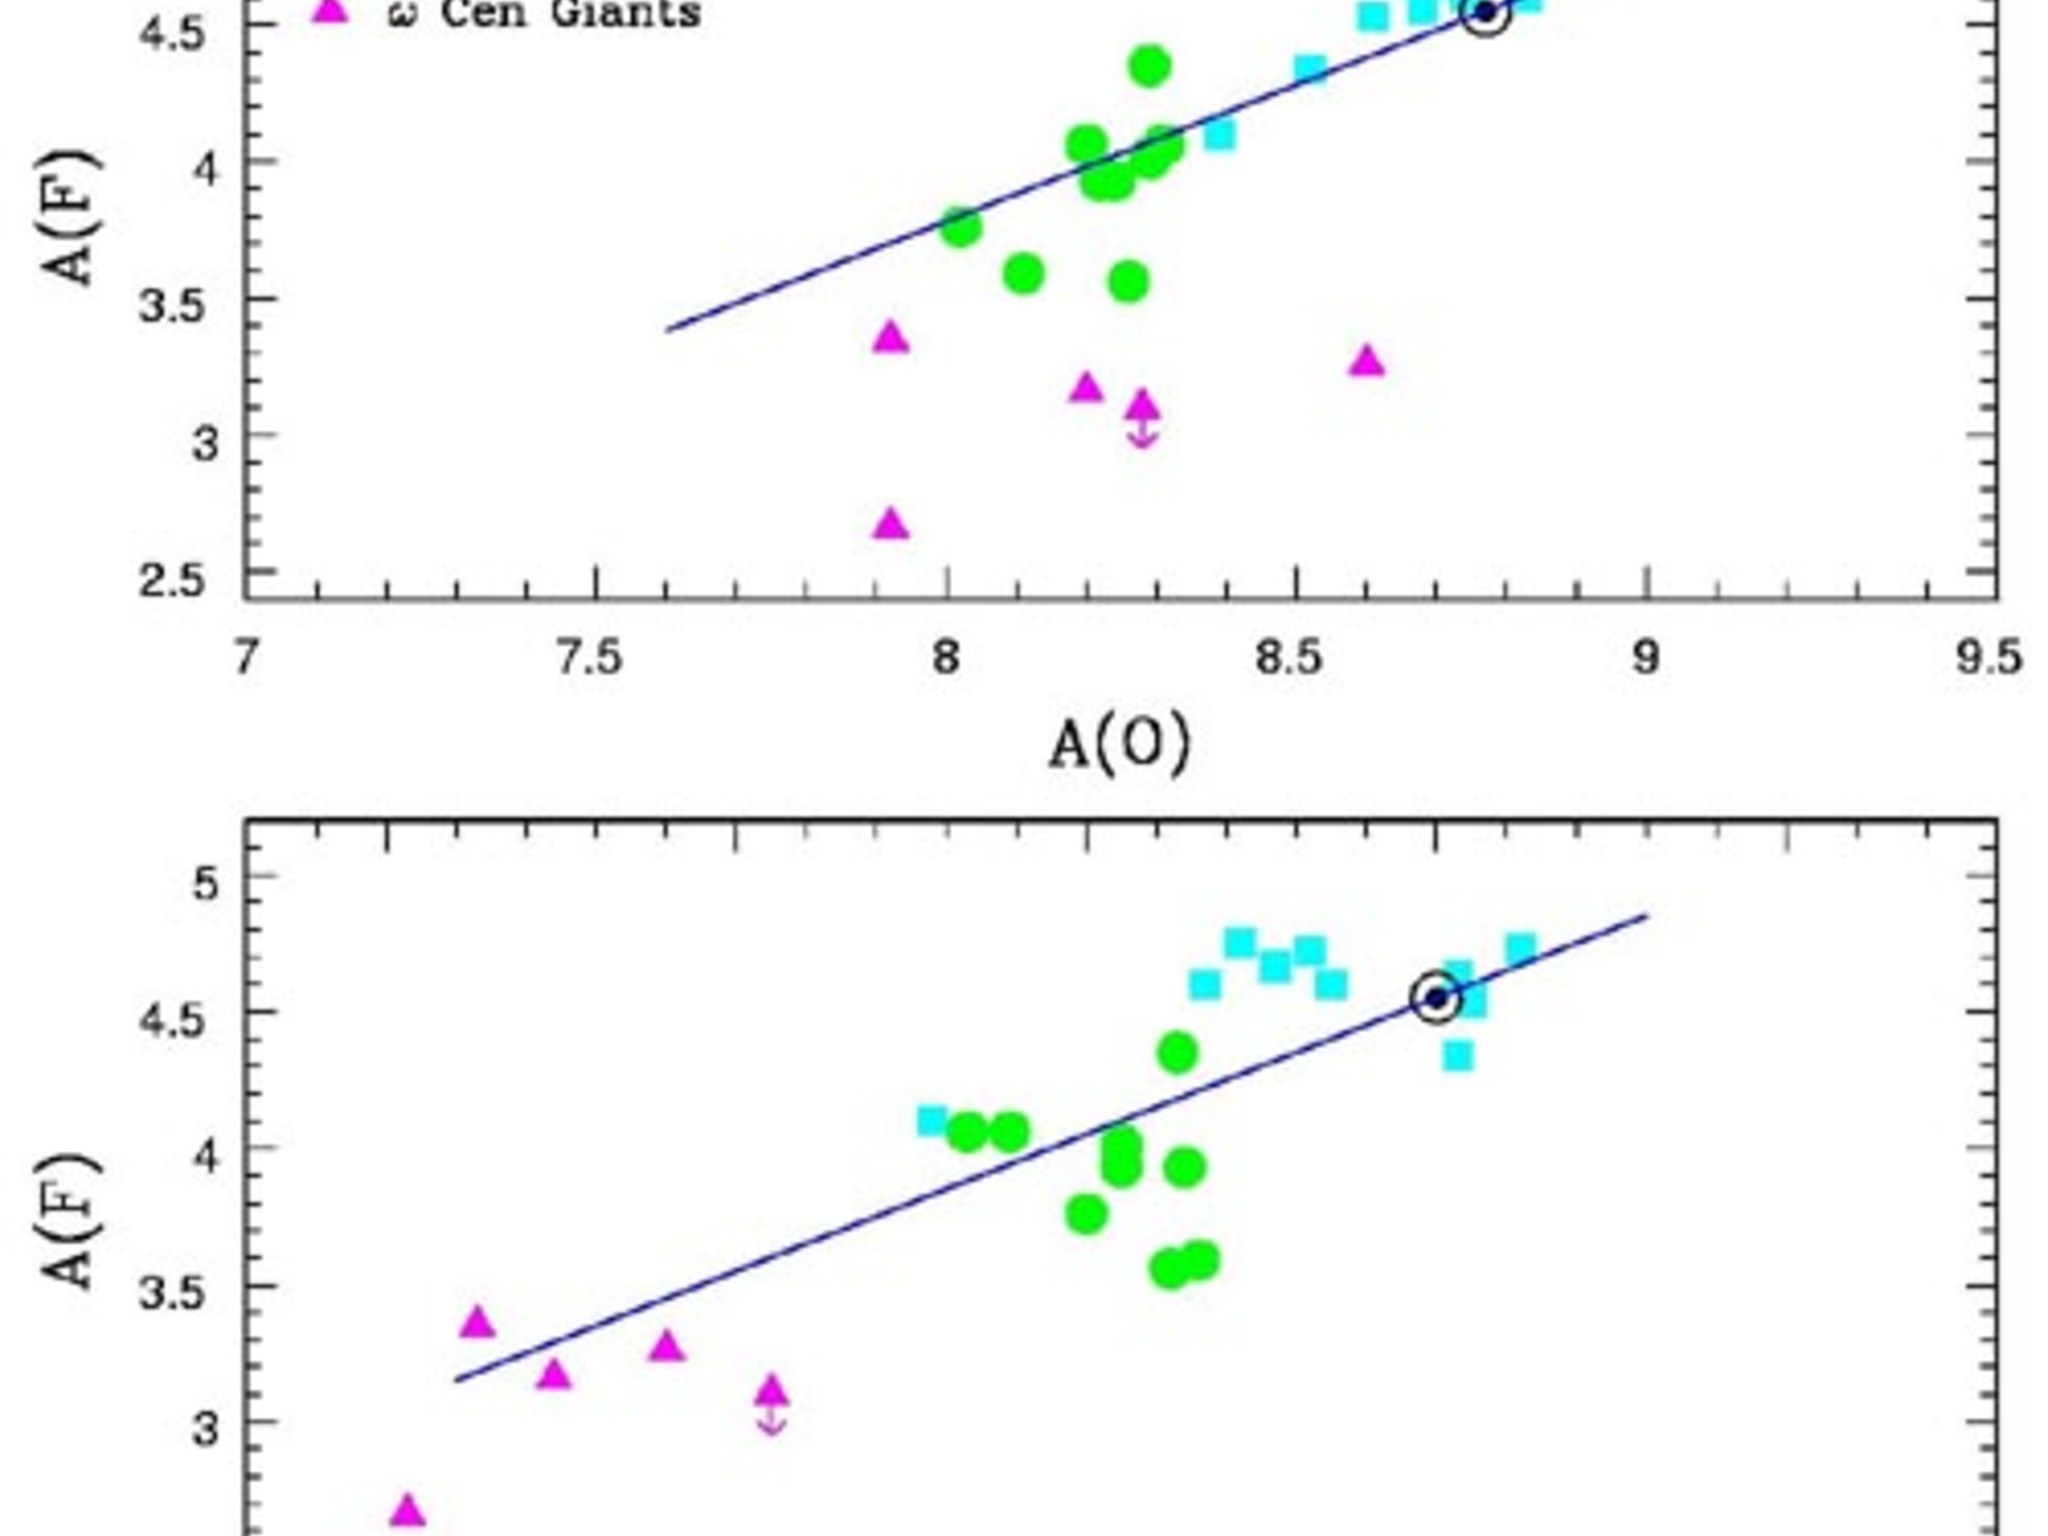
Logarithm abundance of fluorine, A(F), plotted versus oxygen, A(O), and logarithm abundance of fluorine, A(F), plotted versus iron, A(Fe)
Logarithm abundance of fluorine, A(F), plotted versus oxygen, A(O), and logarithm abundance of fluorine, A(F), plotted versus iron, A(Fe). The colors of the symbols refer to the location of the red giants: the Milky Way (blue squares), the LMC (green circles) and ω Centauri (purple triangles). The encircled black dots correspond to the solar abundance of fluorine
Credit:International Gemini Observatory/NOIRLab/NSF/AURA
About the Image
| Id: | geminiann03015b |
| Type: | Chart |
| Release date: | Aug. 19, 2003, 5 a.m. |
| Related announcements: | geminiann03015 |
| Size: | 500 x 516 px |
About the Object
| Category: | Illustrations |