¡Lo sentimos! Esta página aún no está disponible en su idioma preferido, por lo que estamos mostrando la versión original.
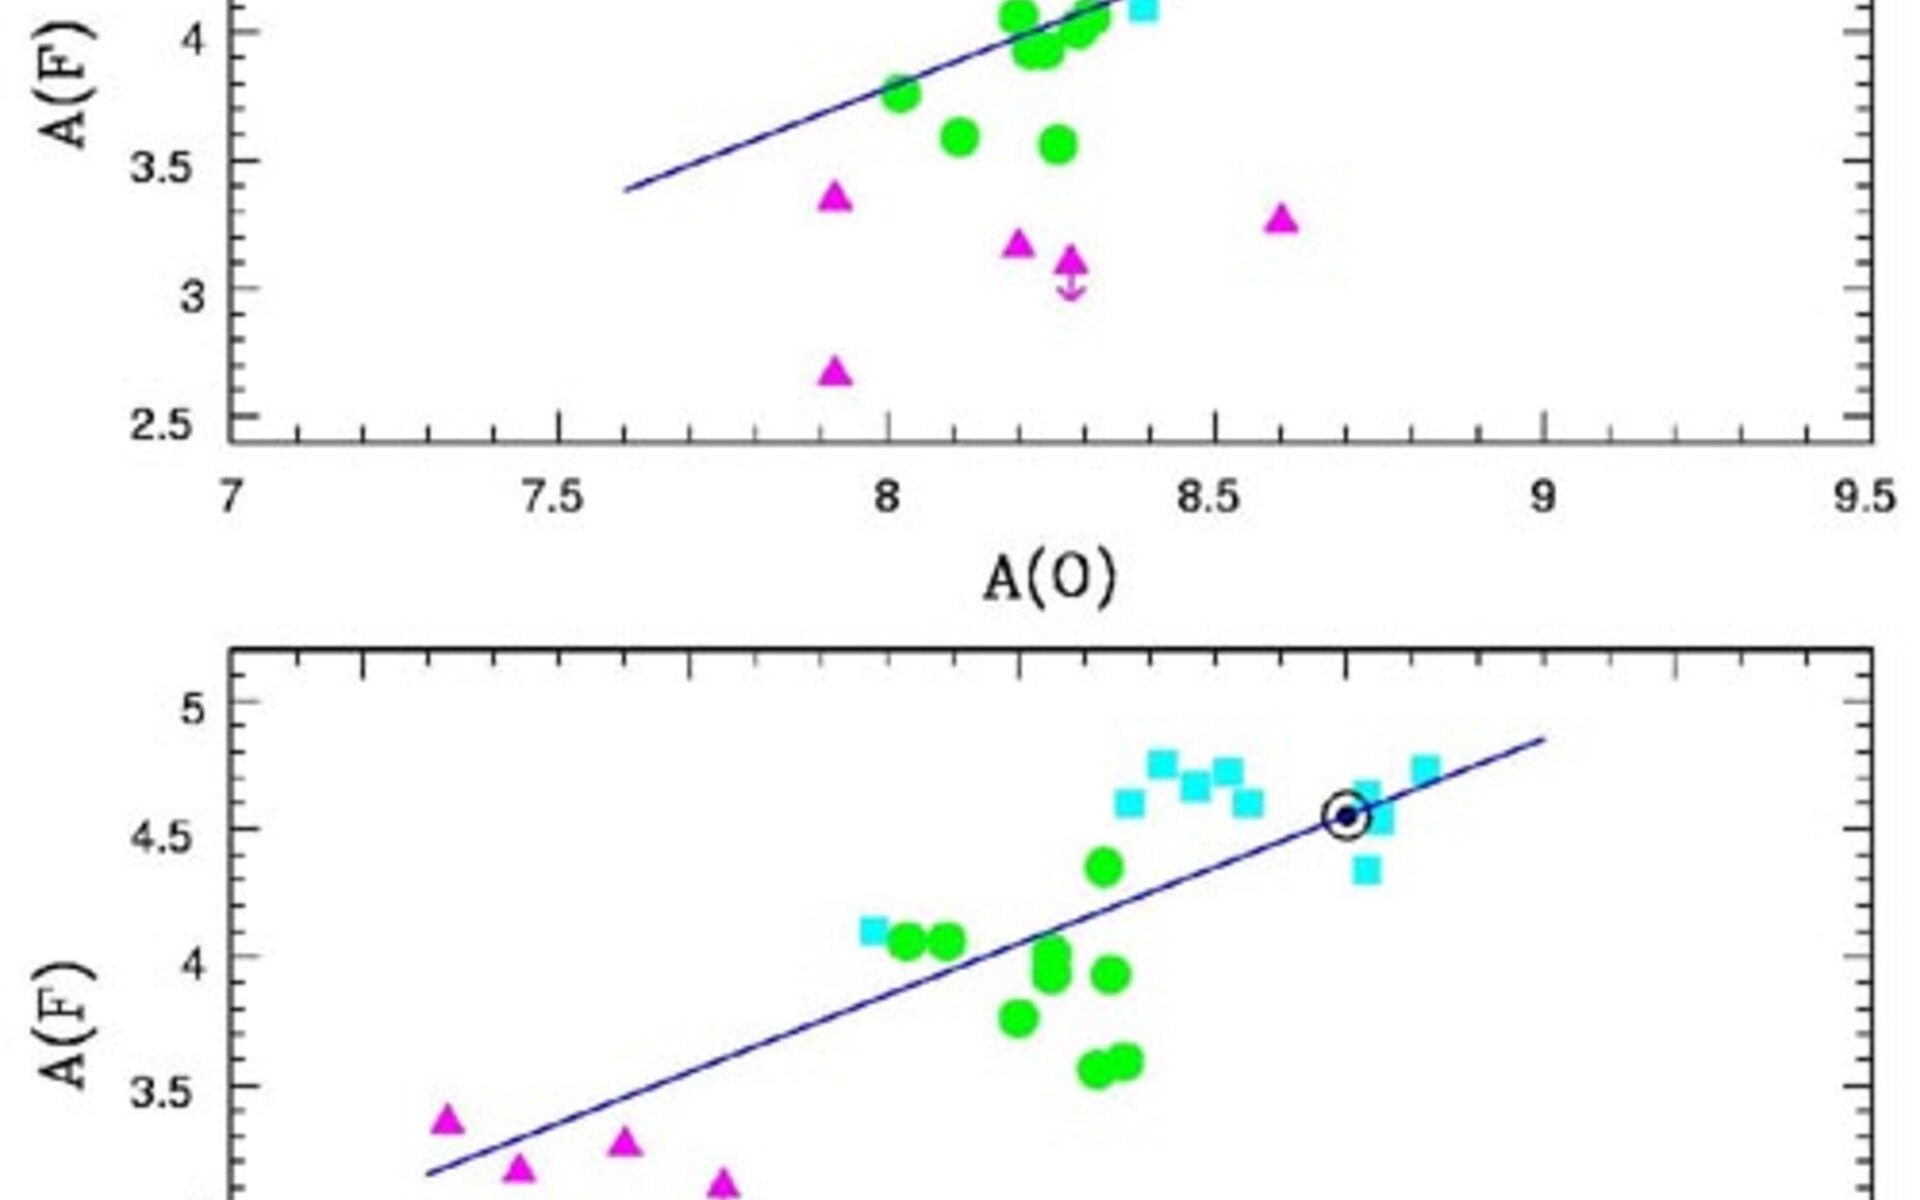
Logarithm abundance of fluorine, A(F), plotted versus oxygen, A(O), and logarithm abundance of fluorine, A(F), plotted versus iron, A(Fe)

Logarithm abundance of fluorine, A(F), plotted versus oxygen, A(O), and logarithm abundance of fluorine, A(F), plotted versus iron, A(Fe). The colors of the symbols refer to the location of the red giants: the Milky Way (blue squares), the LMC (green circles) and ω Centauri (purple triangles). The encircled black dots correspond to the solar abundance of fluorine
Créditos:International Gemini Observatory/NOIRLab/NSF/AURA
About the Image
| Id: | geminiann03015b |
| Tipo: | Chart |
| Release date: | 19 de Agosto de 2003 a las 05:00 |
| Related announcements: | geminiann03015 |
| Size: | 500 x 516 px |
Sobre el Objeto
| Categoría: | Illustrations |