GMOS-IFU data results

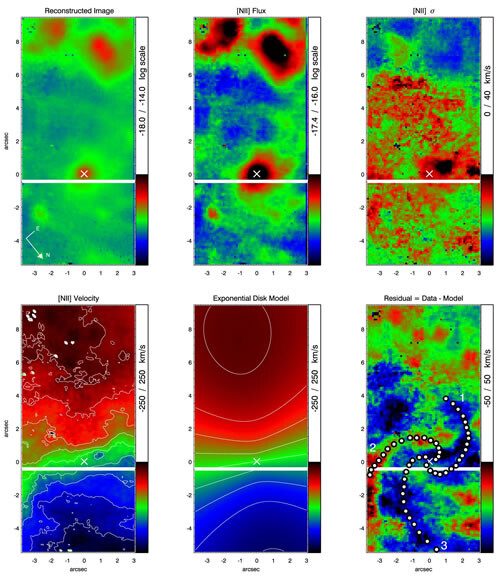
GMOS-IFU data results: Reconstructed image by collapsing the 6300-6850 Å wavelength range (top left); [NII]λ6583 flux distribution (top middle); together with the kinematic maps derived from the [NII]λ6583 emission line, as well as the best-fitting exponential disk velocity field model and residuals. The spiral arms (from Prieto, Maciejewski & Reunanen ApJ 2005) are outlined on the residual map, with the numbers indicating the different arms. In the bottom panels, red color indicates redshift and blue color, blueshift. All panels share the same orientation.
Credit:International Gemini Observatory/NOIRLab/NSF/AURA
About the Image
| Id: | geminiann06003b |
| Type: | Simulation |
| Release date: | Feb. 1, 2006, 1:56 p.m. |
| Related announcements: | geminiann06003 |
| Size: | 500 x 581 px |
About the Object
| Category: | Illustrations |