Galaxies Under the Cosmic Microscope

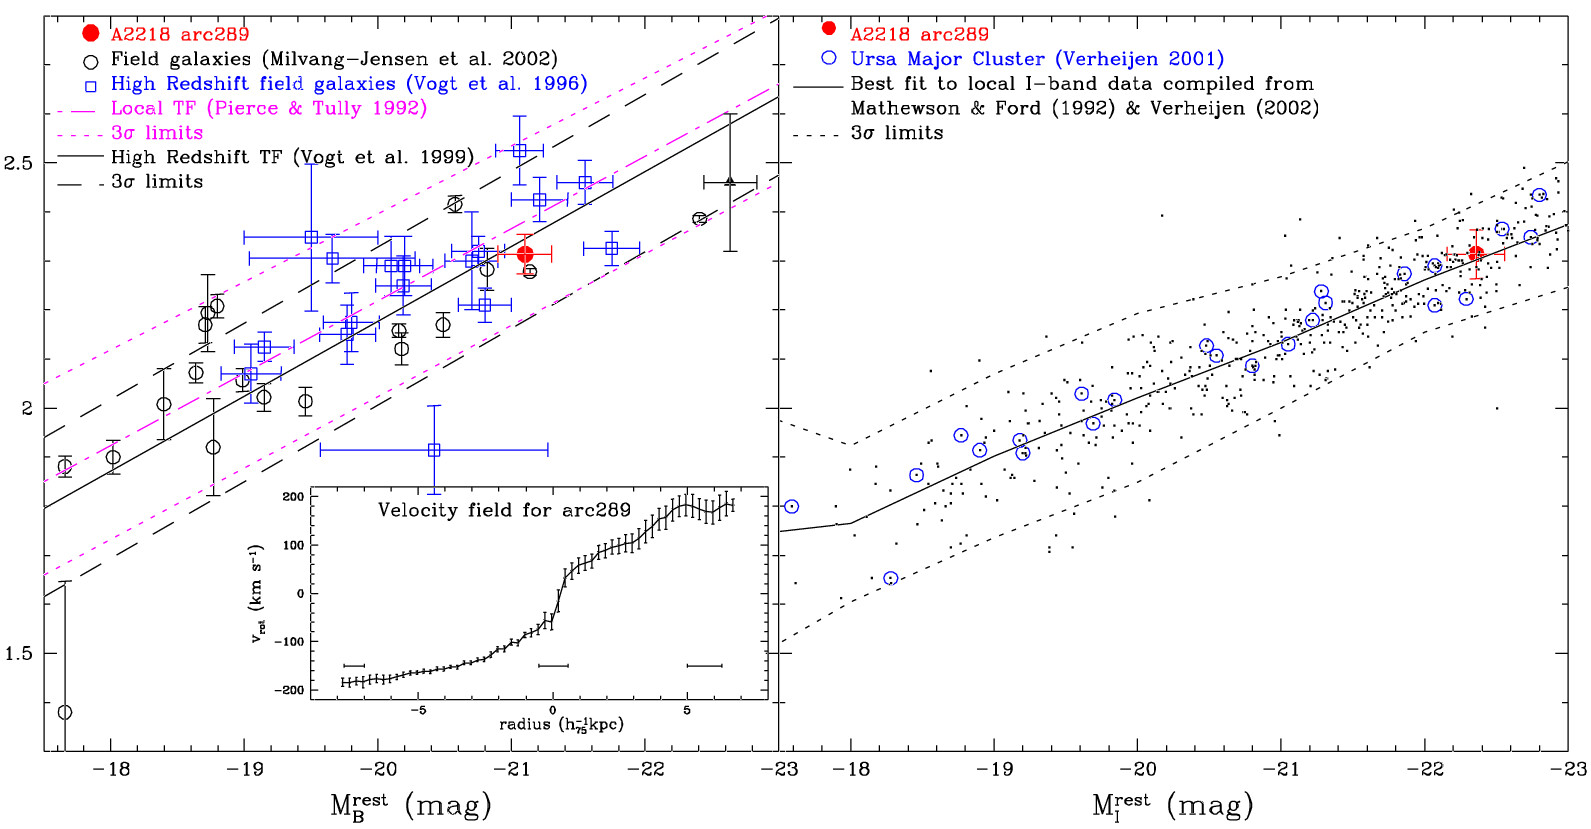
The red dot on the left panel plot shows Arc #289 on the rest frame B-Band Tully-Fisher relation, compared to high redshift (z = 0.83) field galaxies and other data sets. The inset shows the rotation curve derived from the [OII]3727 line GMOS-IFU observations; horizontal error bars are ~0.7 arcsec, seeing transformed to source frame. The right is the I-band Tully-Fisher relation (with Arc #289 as the red dot) from the references indicated in the panel.
Credit:International Gemini Observatory/NOIRLab/NSF/AURA
About the Image
| Id: | geminiann03016f |
| Type: | Chart |
| Release date: | Sept. 2, 2003, 5 a.m. |
| Related announcements: | geminiann03016 |
| Size: | 1591 x 829 px |
About the Object
| Category: | Illustrations |