Baseline CO2 Emissions and Reductions

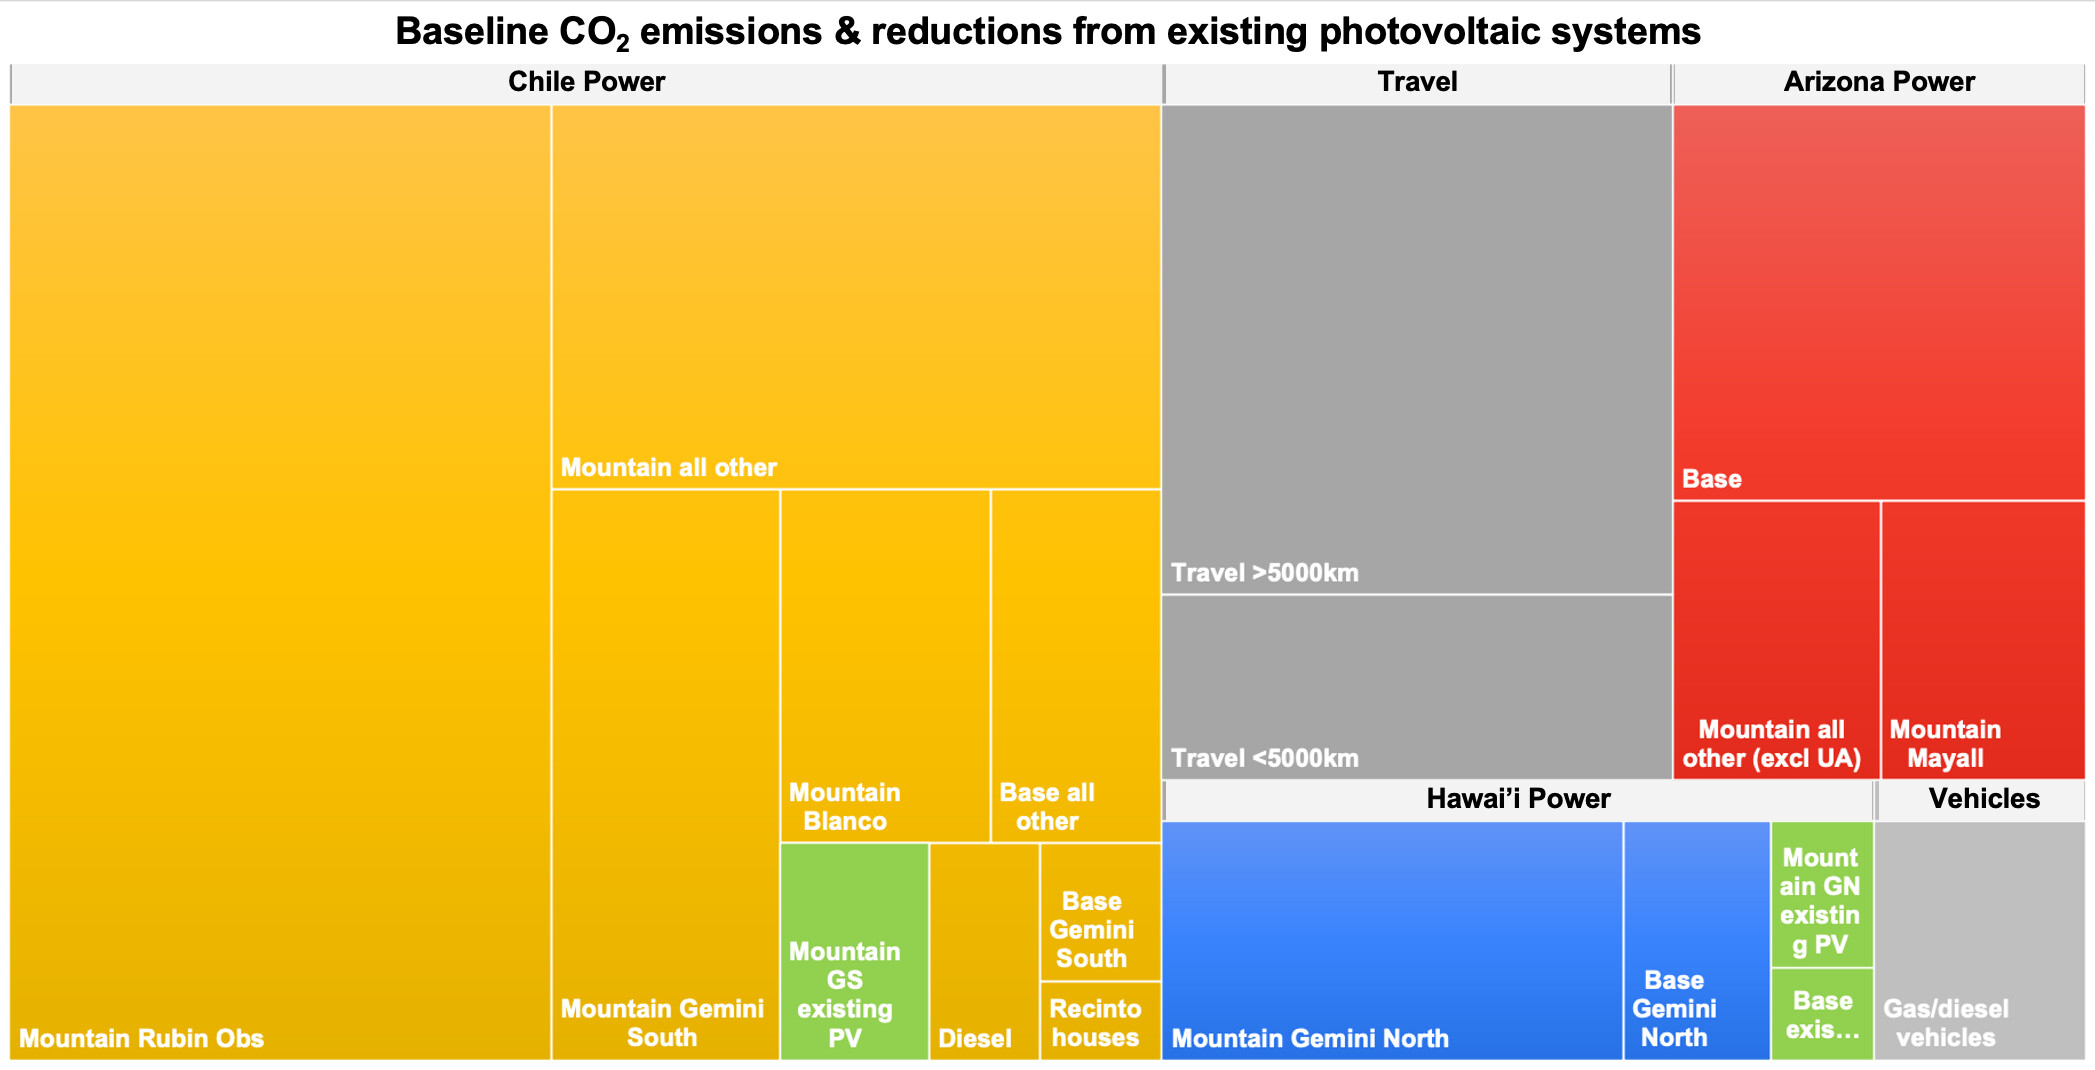
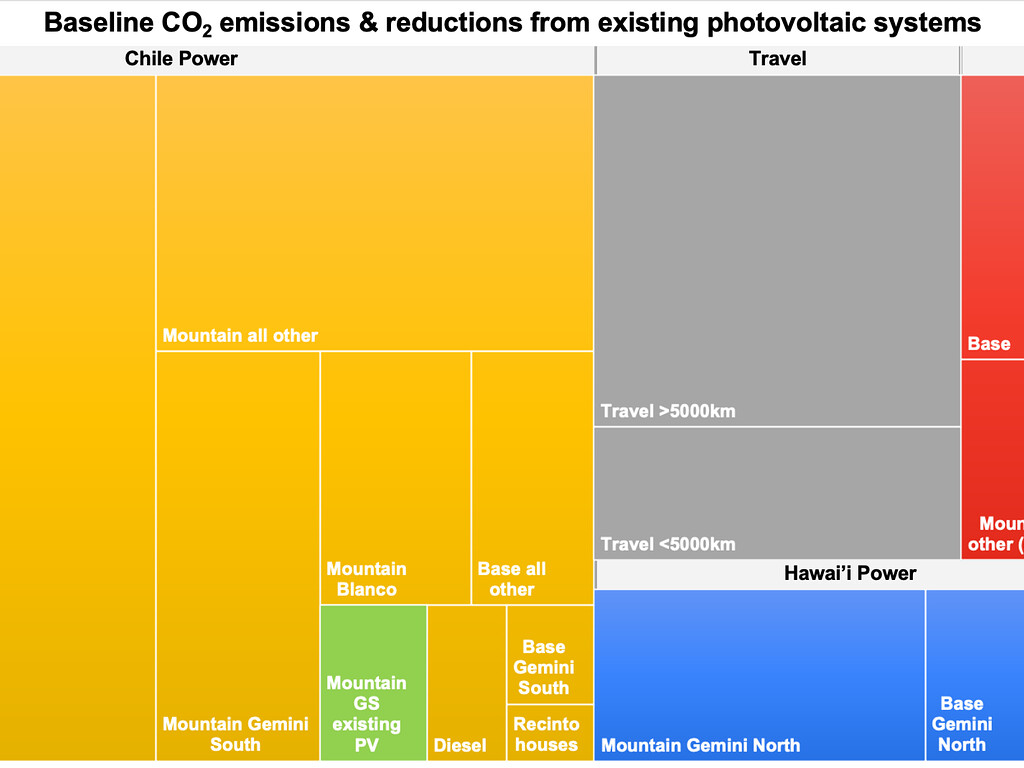
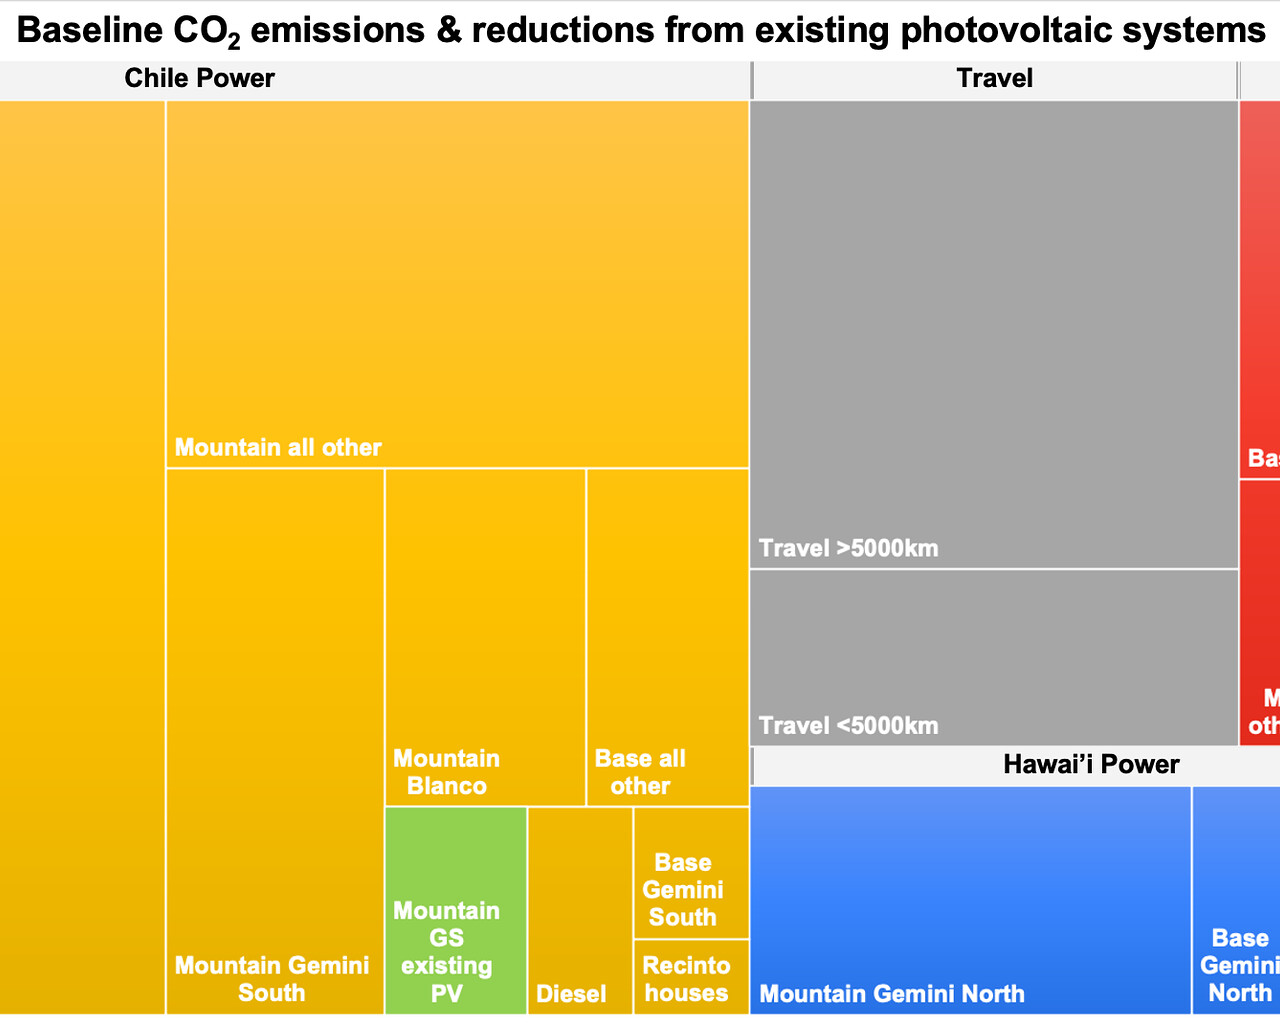
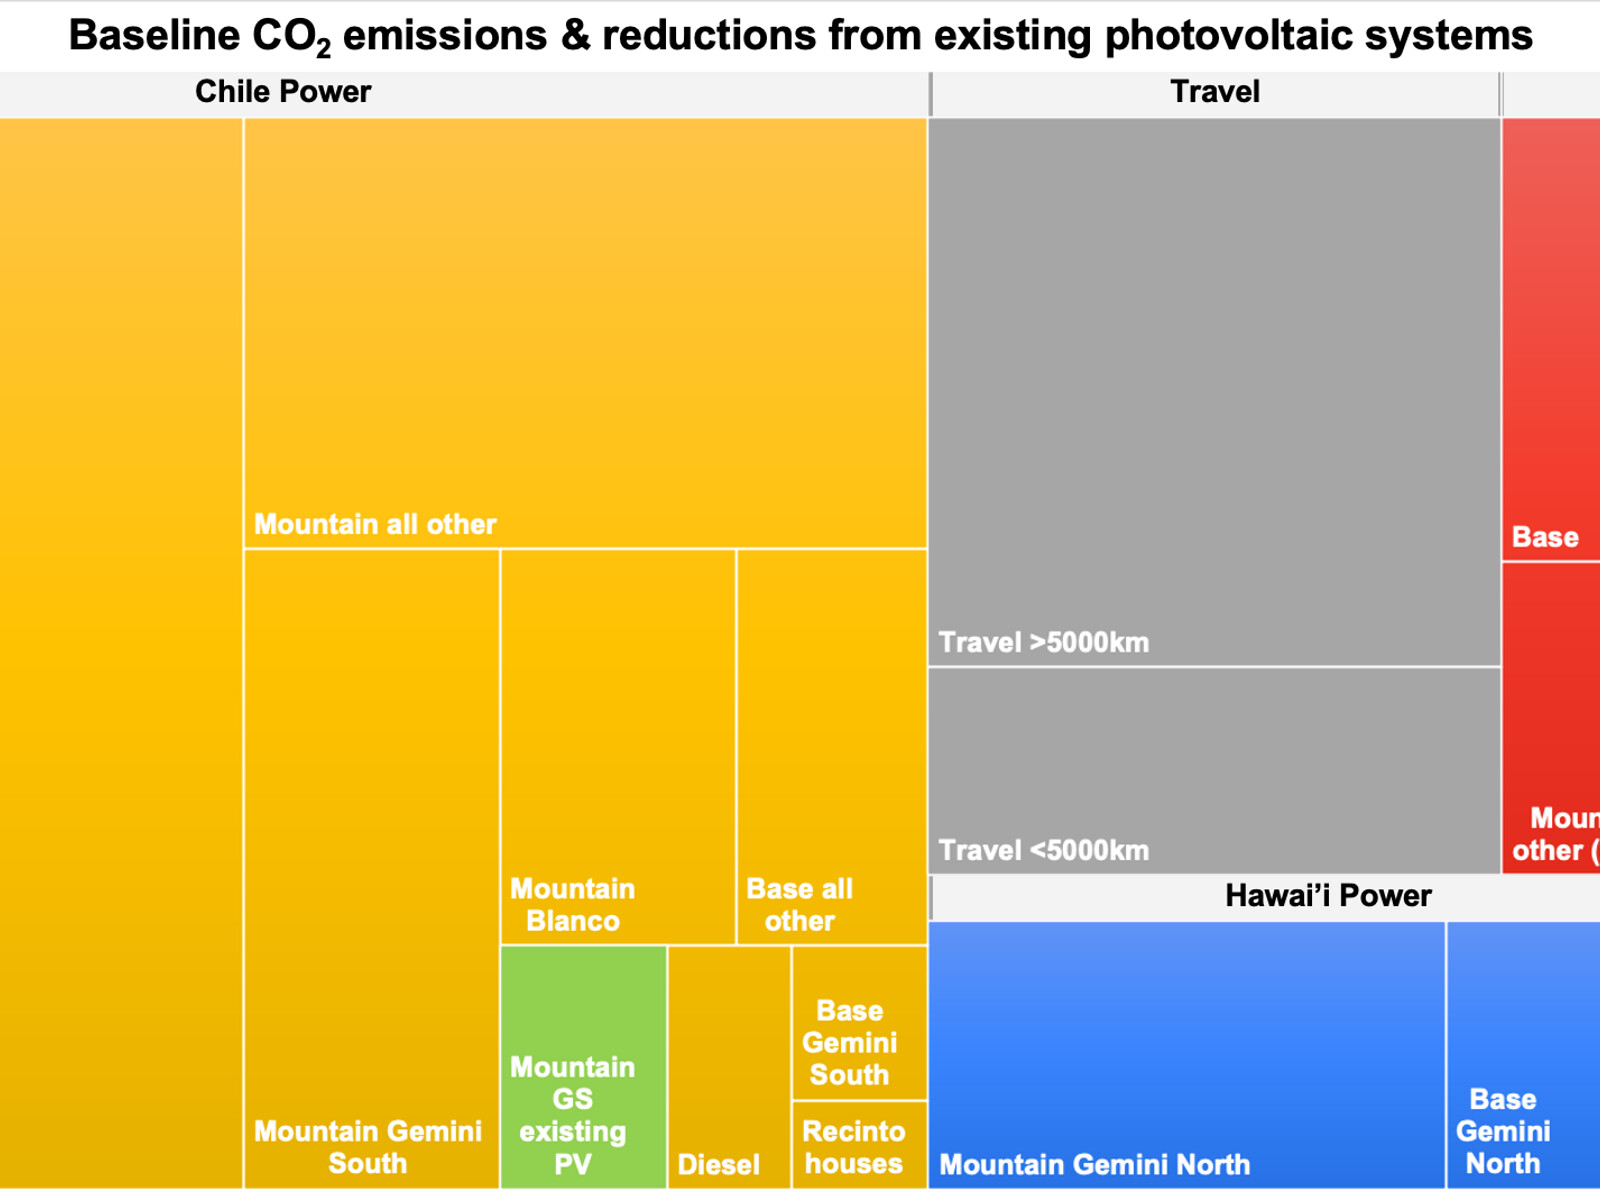
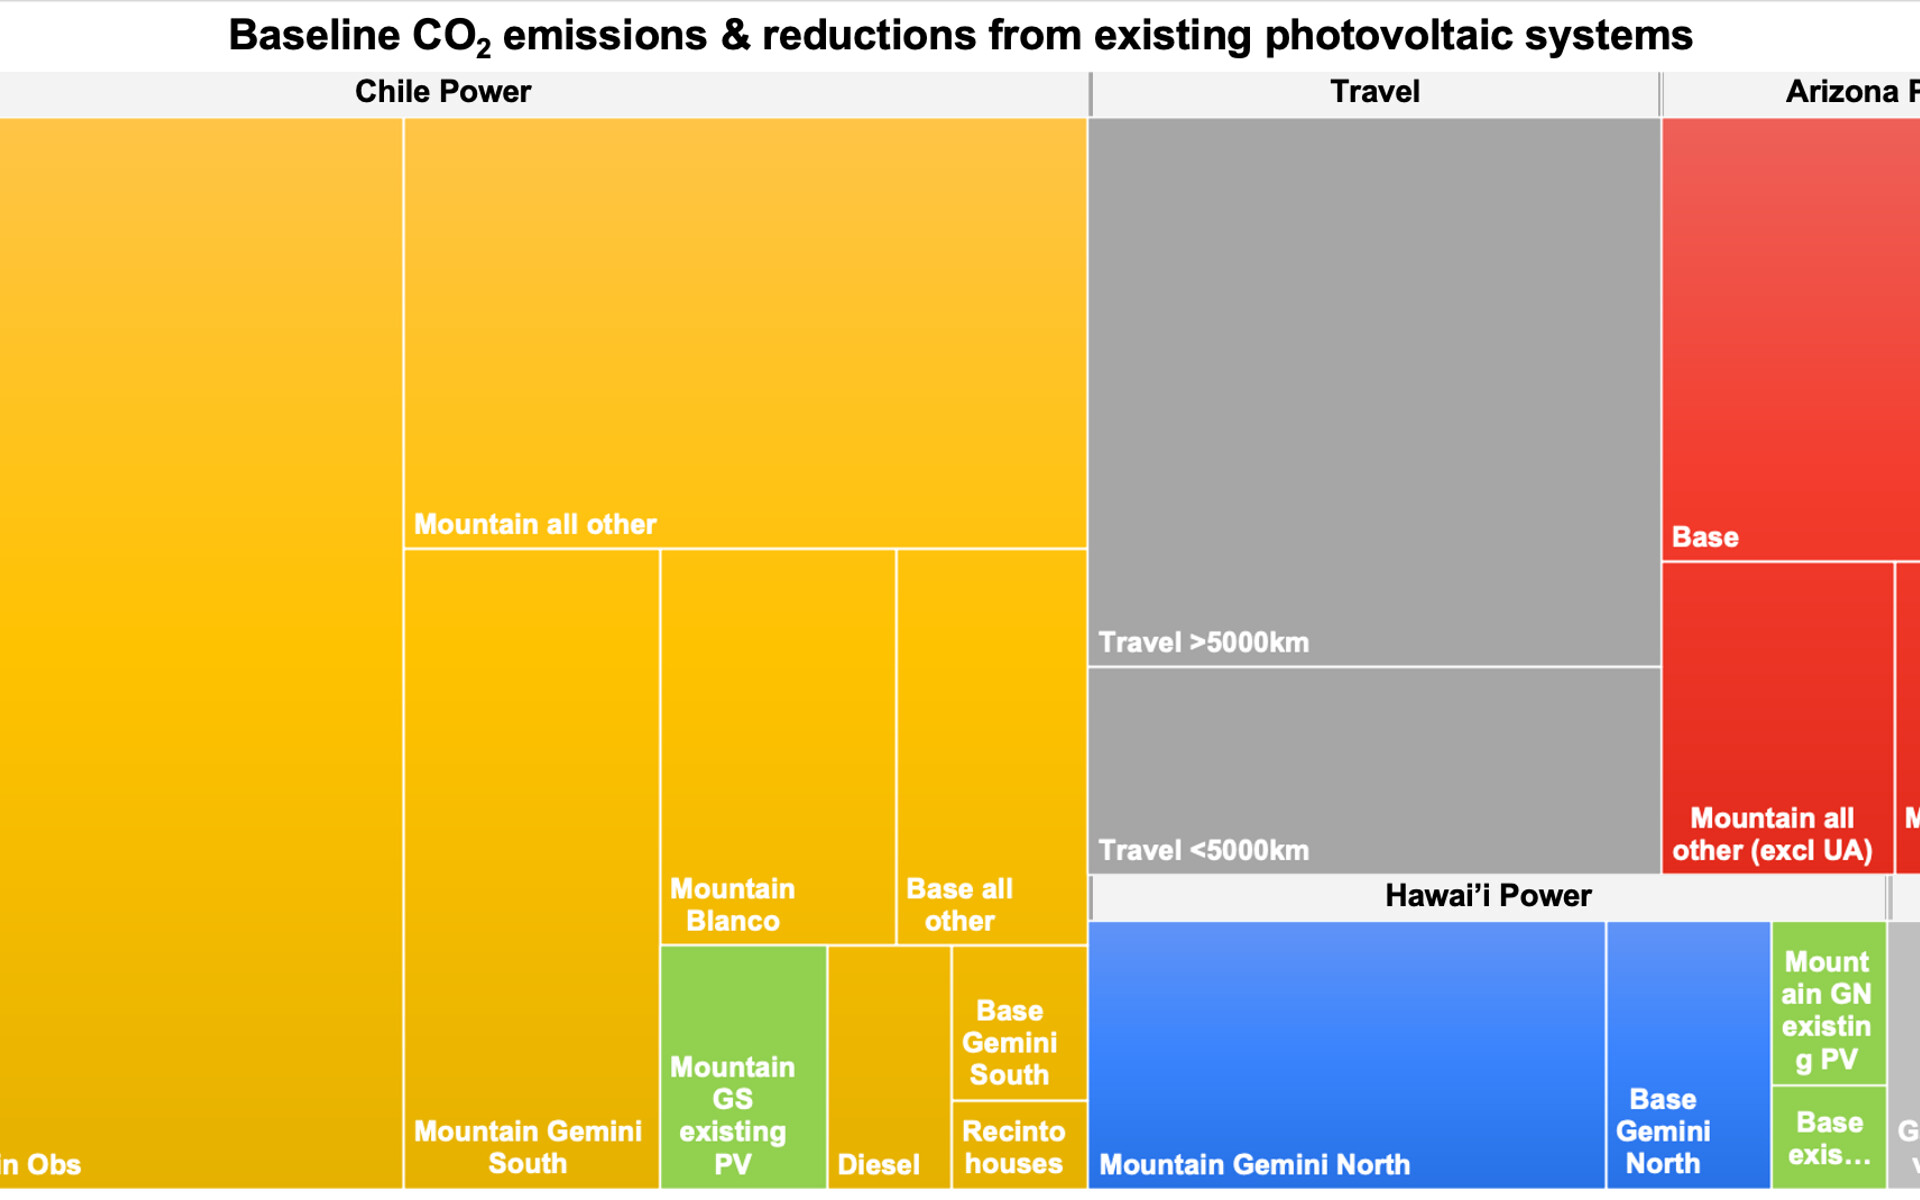
A representation of NOIRLab’s carbon footprint based on the 2019 carbon footprint but also including the expected carbon footprint from Rubin Observatory electricity usage (the rectangle to the far left). The area of each rectangle is proportional to the footprint of the named activity or facility. This includes electricity, diesel use for backup power, travel, and gasoline/diesel powered vehicles. The light green rectangles illustrate the carbon footprint prevented by energy produced by the existing photovoltaic systems at the two Gemini sites.
Credit:NOIRLab/NSF/AURA
About the Image
| Id: | S3-BaselineCO2_Slide3_forweb |
| Type: | Chart |
| Release date: | Nov. 6, 2023, 3:27 p.m. |
| Size: | 2095 x 1070 px |
About the Object
| Category: | Illustrations |