¡Lo sentimos! Esta página aún no está disponible en su idioma preferido, por lo que estamos mostrando la versión original.
Rubin Observatory Operations

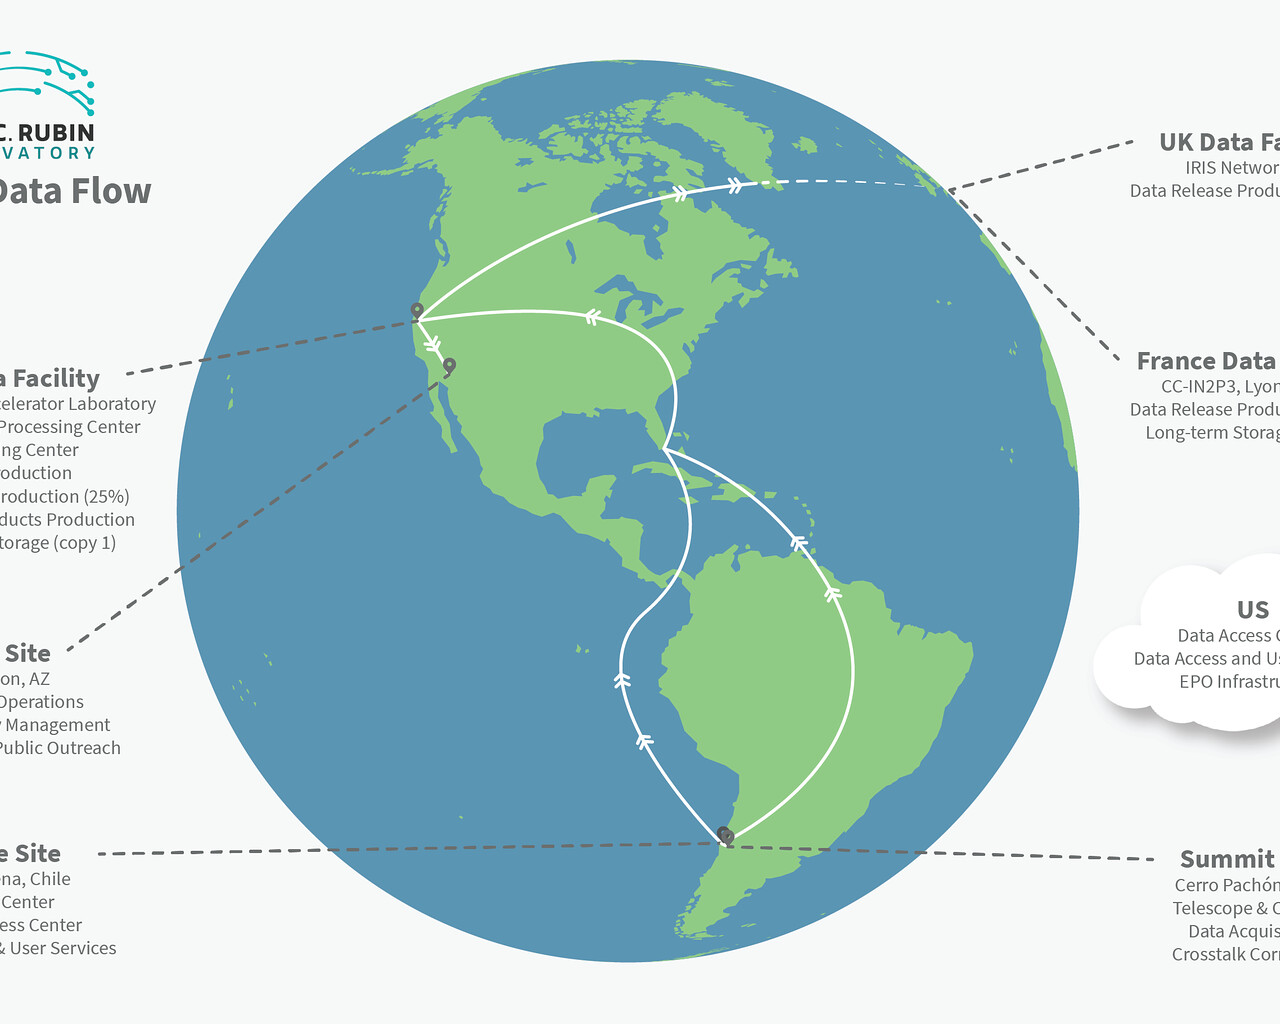
This graphic illustrates data flow between multiple sites during Rubin Operations.The Data Management System begins at the data acquisition interface between camera and telescope subsystems and flows through to the data products accessed by end users. On the way, it moves through three types of managed facilities supporting data management, as well as end user sites that may conduct science using LSST data or pipeline resources on their own computing infrastructure.
Créditos:RubinObs/NOIRLab/SLAC/NSF/DOE/AURA
About the Image
| Id: | rubin-Sites_and_Data_Flows_Map |
| Tipo: | Chart |
| Release date: | 7 de Abril de 2023 a las 15:44 |
| Size: | 3000 x 1821 px |
Sobre el Objeto
| Categoría: | Illustrations Vera C. Rubin Observatory |