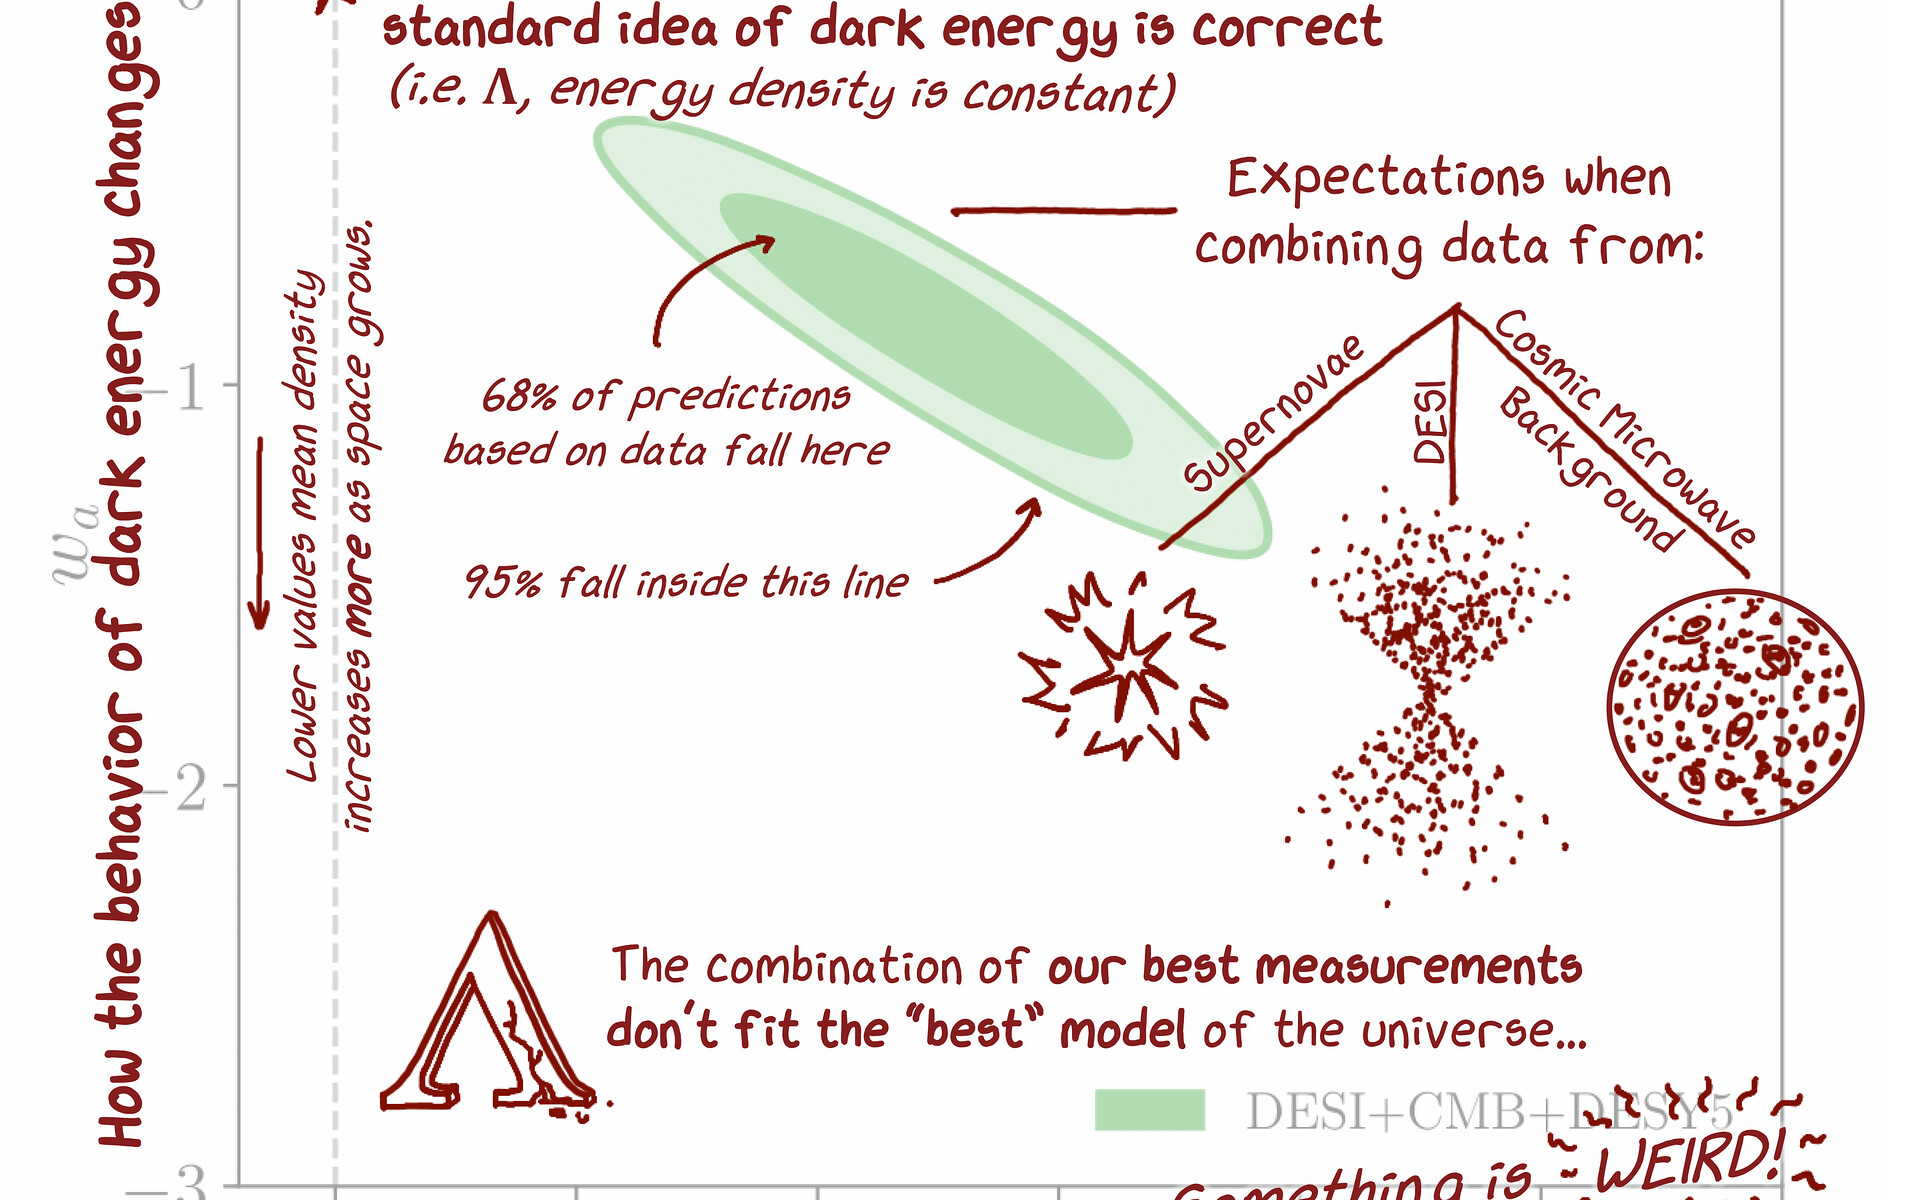
DESI Contour Plot (annotated)

An annotated version of a contour plot from DESI's new dark energy analysis, showing the constraints on parameters of evolving dark energy. The plot describes the ‘behavior’ of dark energy — how its density changes as space expands. View the non-annotated plot here.
Credit:DESI Collaboration/DOE/KPNO/NOIRLab/NSF/AURA/C. Garcia-Quintero
About the Image
| Id: | noirlab2512ad |
| Type: | Chart |
| Release date: | March 19, 2025, 3 p.m. |
| Related releases: | noirlab2512 |
| Size: | 8000 x 6857 px |