¡Lo sentimos! Esta página aún no está disponible en su idioma preferido, por lo que estamos mostrando la versión original.
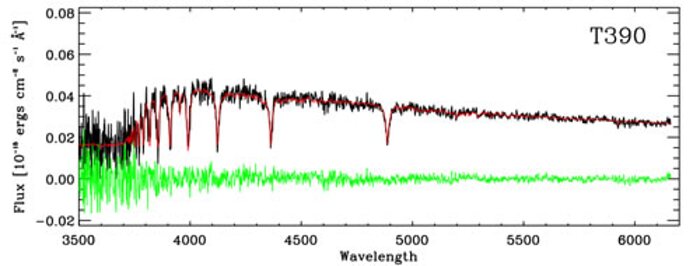
Example of GMOS spectra for one cluster in the sample (T390)
Example of GMOS spectra for one cluster in the sample (T390) used for this work. The observed spectrum has been corrected for the estimated interstellar extinction. The black line represents the observed spectra, red line the best-fitting model template (age and metallicity) and green line the residual (observed cluster−best-fitting template). The calculated age and metallicity T390 are ~200 Myr and 1.1 Zsun (essentially solar).
Créditos:International Gemini Observatory/NOIRLab/NSF/AURA
About the Image
| Id: | geminiann09016c |
| Tipo: | Chart |
| Release date: | 14 de Julio de 2009 a las 13:35 |
| Related announcements: | geminiann09016 |
| Size: | 500 x 190 px |
Sobre el Objeto
| Nombre: | Gemini Multi-Object Spectrograph (GMOS) |
| Categoría: | Illustrations |