Goodman Blue Camera
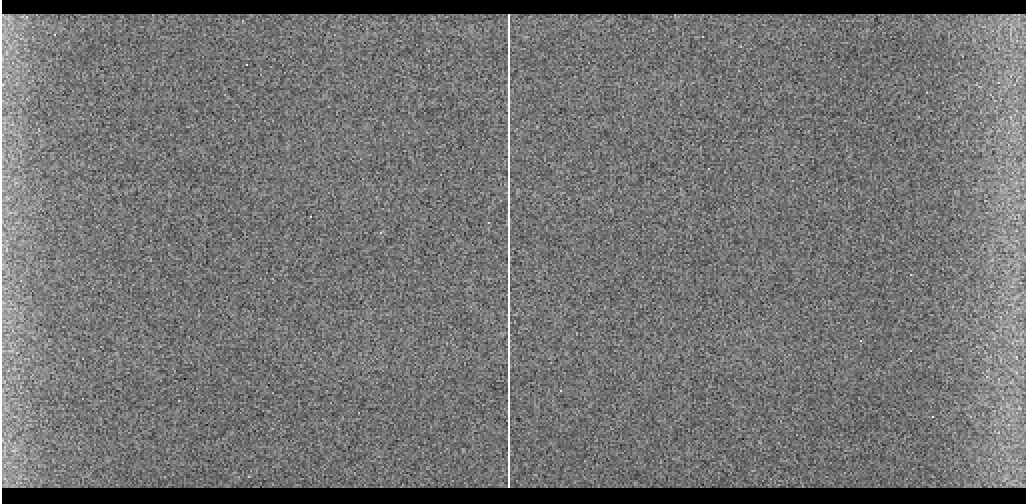
The SOAR Goodman Spectrograph Blue Camera features one 4096 x 4096 pixel Fairchild CCD. The CCD is read out through 1 amplifier using a Spectral Instruments controller. This CCD has only minor flaws which has little impact on its scientific performance. Figure 1 shows the combination of 20 bias frames taken with the 200ATTN0 readout mode (Readout Noise= 4.74 e-, Gain=1.4 e-/ADU), with the Spectroscopic 1x1 ROI.
Figure 1. Combined Bias frames in Spectroscopic 1x1 mode (average of 20 individual bias taken with the 200ATTN0 readout mode).
Figure 2 below shows an internal quartz lamp flat for the 400 l/mm grating in the 400M2 setup (505-905 nm). Note the fringing pattern at the red end of the image.
Figure 2: An internal quartz lamp flat of the 400l/mm grating in the 400M2 setup, taken with a Multi-Object Slit (MOS) Mask, The upper two and lower srtpes correspond to the square boxes for the alignment stars. The middle stripes are the quartz flats produced with the four science target slits.
Figure 3 shows the QE of the Goodman Blue Camera CCD.
Figure 3: The QE curve of the Goodman CCD.
Below we provide the general characteristics of the Blue Camera detector and the available readout modes:
The default image size for imaging mode (1x1 binning) is 3096 x 3096 pixels and the default image size for spectroscopic mode is 4142 x 1896 pixels with 1x1 binning. These values were used calculate the read out times given above using one amplifier readout. Users should also expect 1 or 2 seconds of overhead on every exposure.
Throughput:
The imaging mode throughput of the GOODMAN BLUE CAMERA has been measured relative to the SOAR Optical Imager (SOI) for which we have good zero-points. As the table below shows, the throughput relative to SOI is better in the R, comparable in the V and lower in the B and U.
In the Goodman Throughput Information page we show the measured the spectroscopic throughput of the Goodman BLUE CAMERA, obtained by taking spectra of spectrophotometric standards with the most commonly used preset setups. These curves show the overall system efficiency for the telescope+instrument+detector combination, with and without the Atmospheric Dispersion Corrector (ADC), commissioned in late 2014. That is, they show the fraction of photons striking the primary mirror of SOAR which are eventually detected by the CCD. The measurements were made using a very wide (~10 arcsec slit); slit losses will reduce the efficiency obtained when using a narrower slit by an amount which depends on the seeing. The measurements are corrected for atmospheric extinction; the efficiency obtained in an actual observation will be reduced by the atmospheric extinction for the airmass of observation.
Goodman Blue Camera Cold Start Procedure - for SOAR Support Staff
Updated on May 27, 2021, 11:59 am


