Cluster age dating
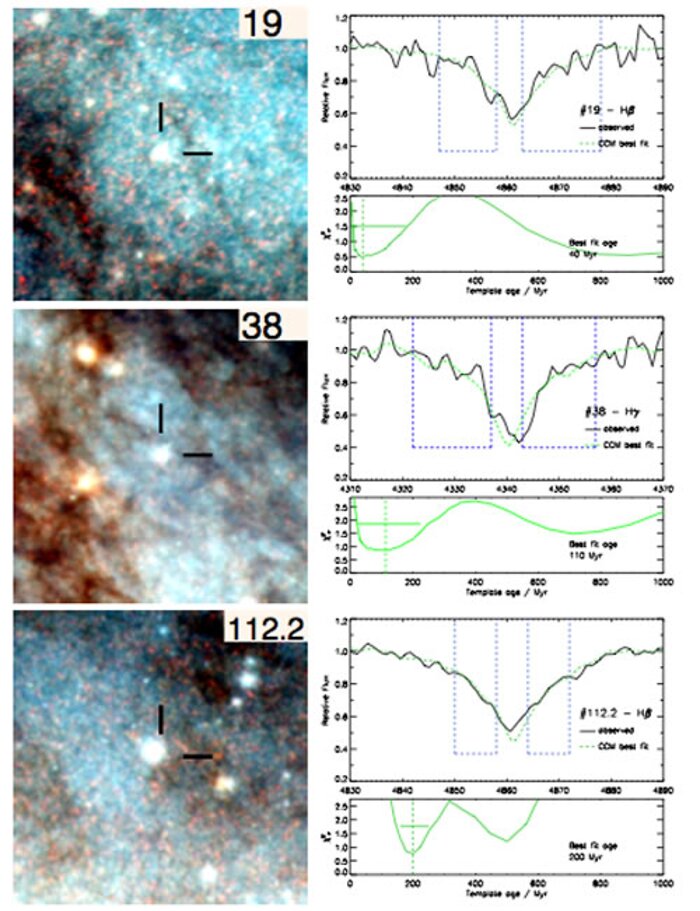
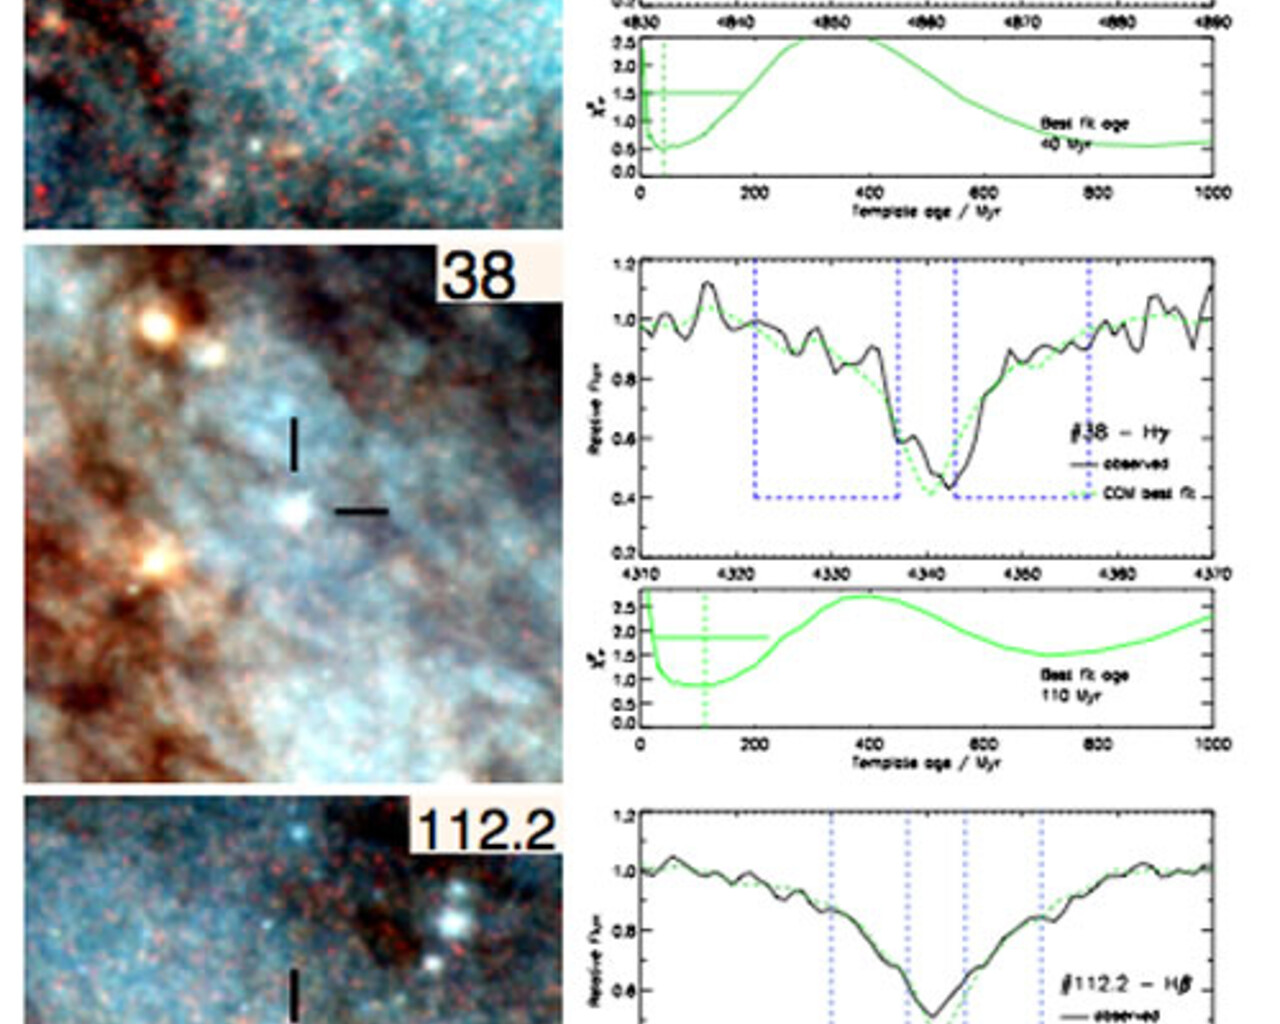
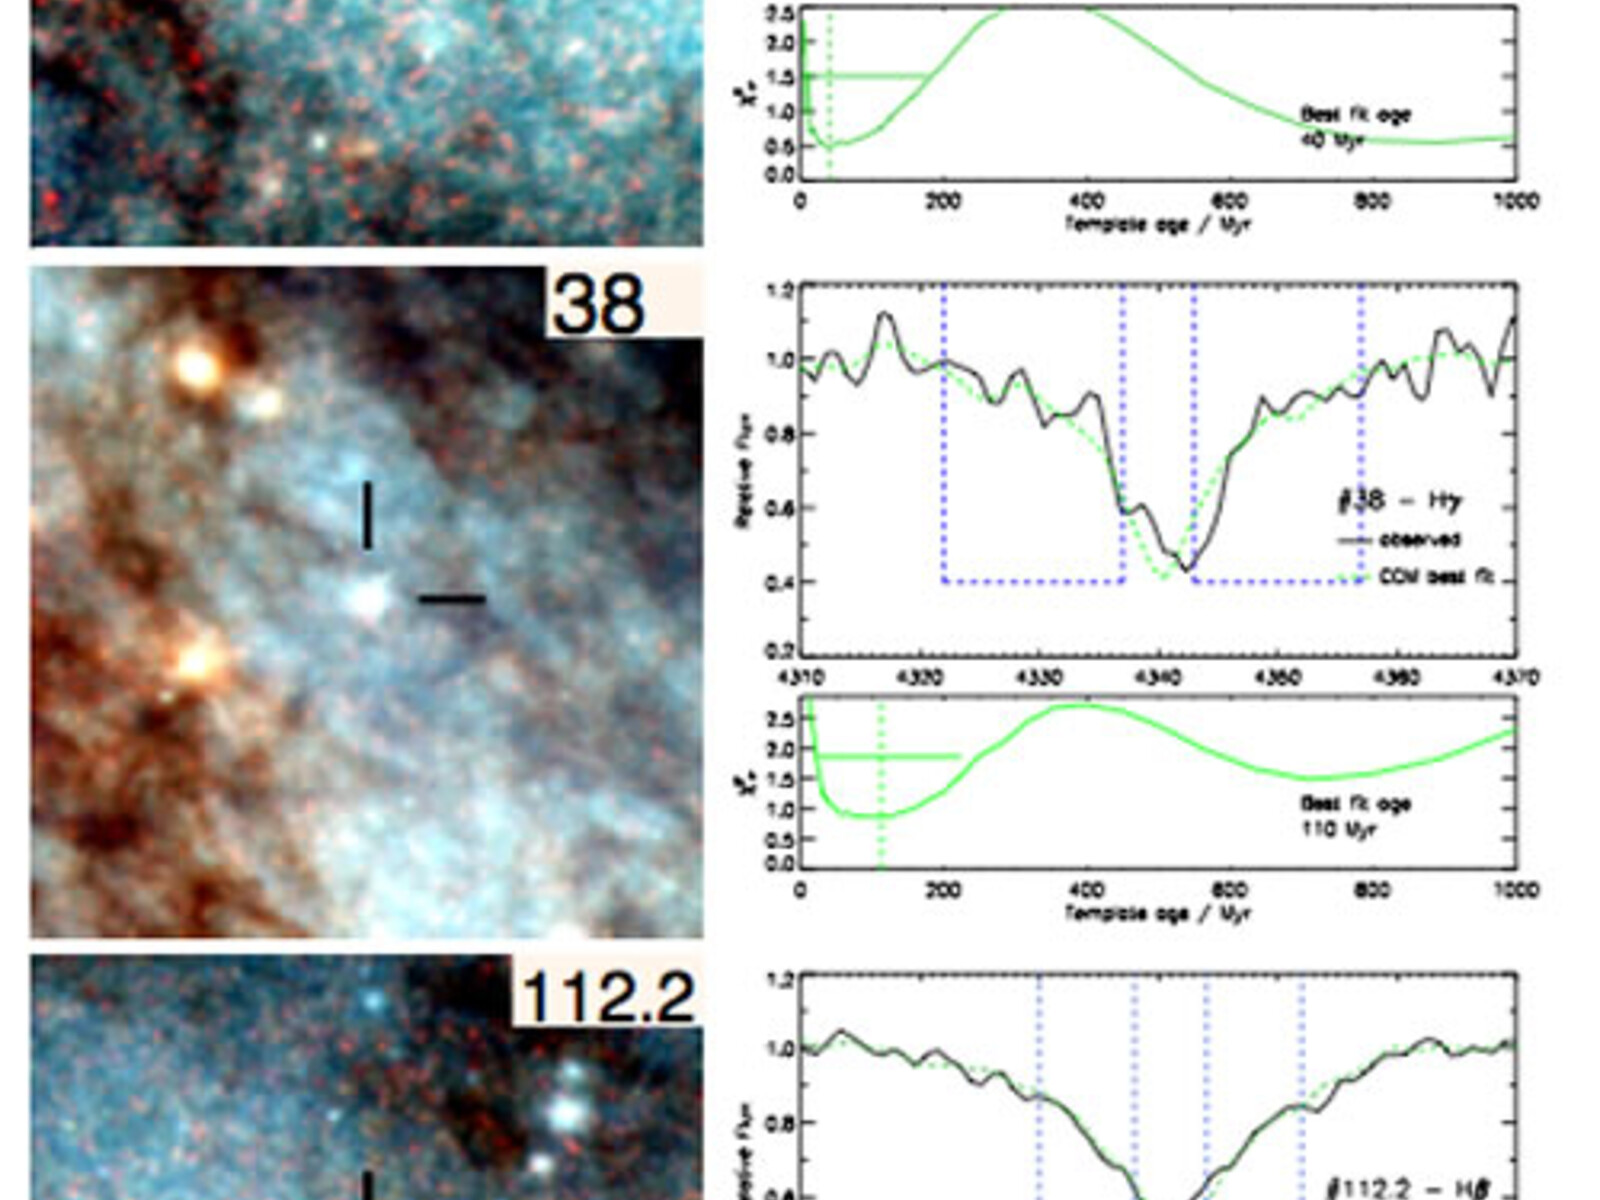
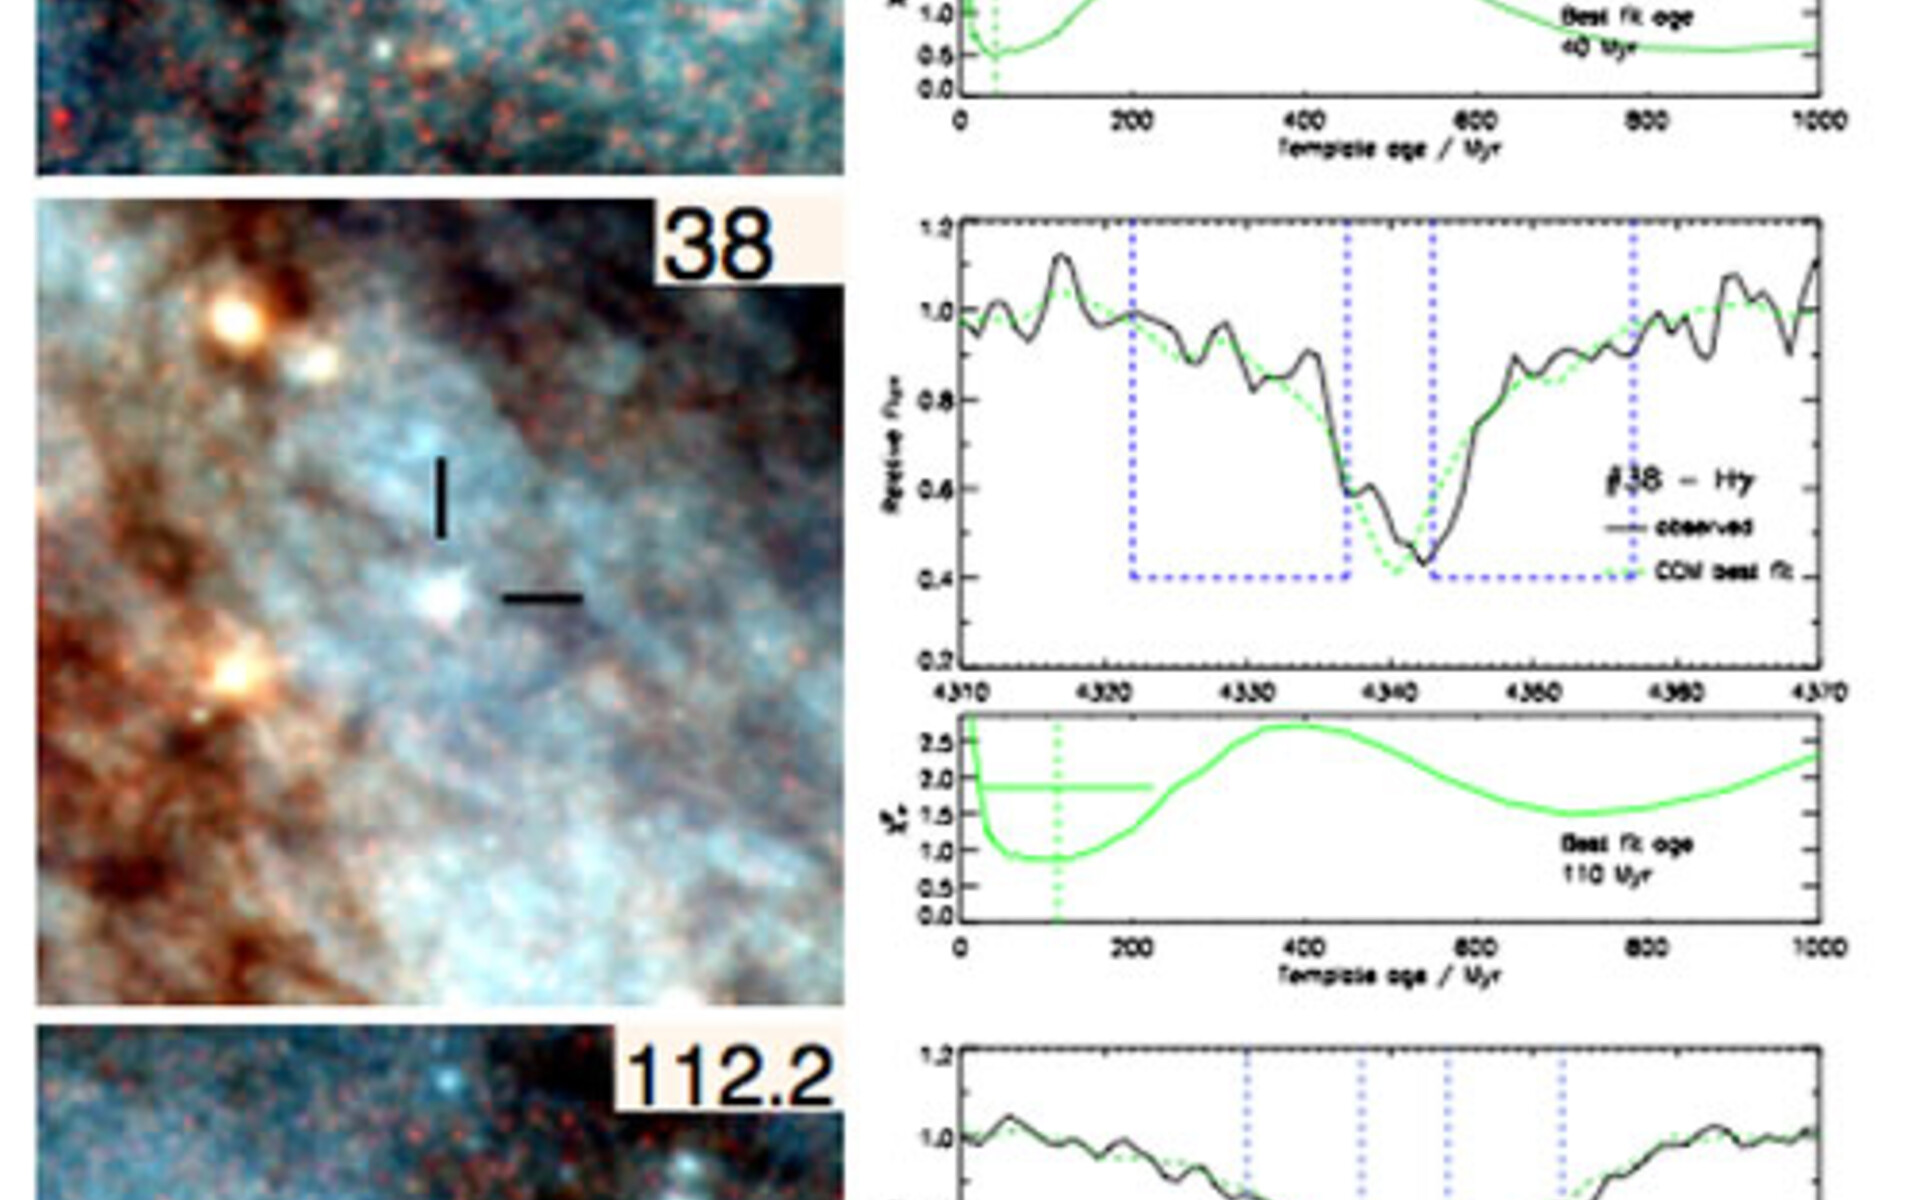
Cluster age dating. Each of these three image-spectrum pairs represents a BVI composite image and part of its optical spectrum. The spatial scale of the images is a square of side 175 pc. In the spectra, the top panel shows the age fit, with the solid line and dashed lines representing the observed spectrum and best fitting model respectively. The dashed blue boxes indicate the spectral regions where the fit takes place. The bottom panel shows the probability distribution of the fit across age-space, with a vertical line indicating the best fitting age and a horizontal line to delimit a confidence region.
Credit:International Gemini Observatory/NOIRLab/NSF/AURA
About the Image
| Id: | geminiann09013b |
| Type: | Collage |
| Release date: | June 24, 2009, 1:41 p.m. |
| Related announcements: | geminiann09013 |
| Size: | 500 x 651 px |
About the Object
| Category: | Galaxies Illustrations |