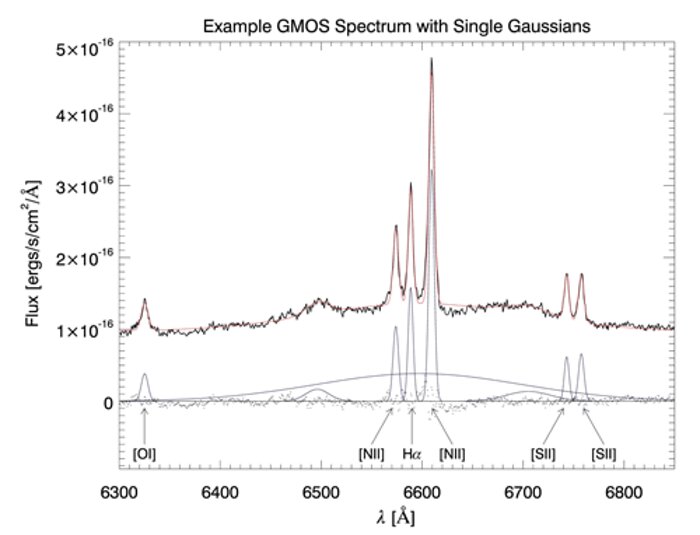
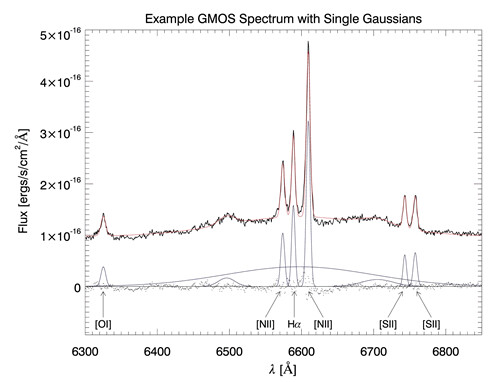
Example GMOS Spectrum with Single Gaussians
Sample spectrum showing the nuclear broad Hα component, as well as the narrow emission lines. Overplotted are the entire set of single Gaussians with the individual Gaussians plotted at the zero level, together with the residuals (dots) from the fit of the Gaussians plus a fixed continuum level. The three “unmarked" Gaussians are a fit simply to remove nuisance structure due to the double-peaked broad Hα emission-line and should not be interpreted as an accurate model of the broad line region.
Credit:International Gemini Observatory/NOIRLab/NSF/AURA
About the Image
| Id: | geminiann06003a |
| Type: | Chart |
| Release date: | Feb. 1, 2006, 1:56 p.m. |
| Related announcements: | geminiann06003 |
| Size: | 500 x 382 px |
About the Object
| Category: | Illustrations |