Kinematic fits for the four clumpy targets
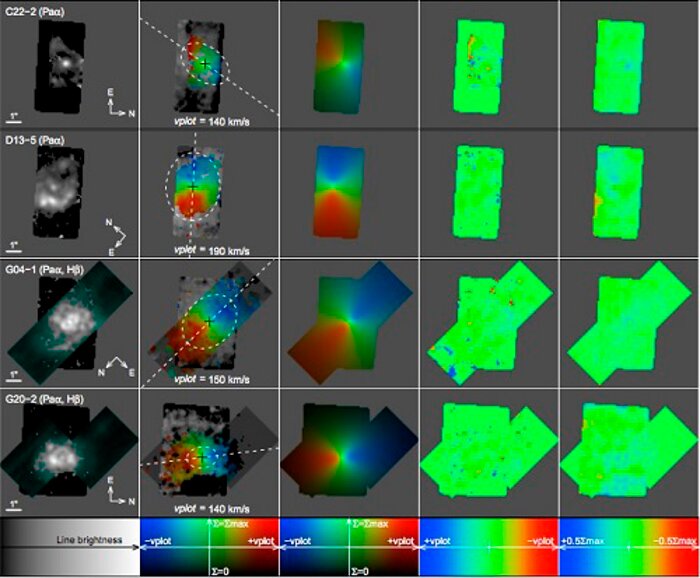
Kinematic fits for the four clumpy targets. Column 1: Emission line fluxes of the Paα (OSIRIS) and Hβ (GMOS) lines, as indicated in parentheses; Hβ is shown in cyan for distinction from Paα. Columns 2&3: Density+velocity maps of data and models, respectively. Lightness represents the continuum surface brightness and hue represents the rest-frame line-of-sight velocity of the emission lines. A greyscale is used where only continuum data is available. White dashed lines show the best-fit major axes and half-mass ellipses. Columns 4&5: Maps of the line-of-sight velocity residuals ∆v 0 = v 0 − v 0 model and stellar density residuals ∆Σs = Σs – Σ models. Image Credit: Obreschkow, D. et. al.; ICRAR
Credit:International Gemini Observatory/NOIRLab/NSF/AURA
About the Image
| Id: | geminiann15017b |
| Type: | Collage |
| Release date: | Dec. 14, 2015, 6:36 p.m. |
| Related announcements: | geminiann15017 |
| Size: | 500 x 413 px |
About the Object
| Category: | Illustrations |